Industrial Insights Newsletter
Industrial Insights - Fall 2026 Hundreds and Owner-User Reports
Large-block availability, owner-user inventory, recent transactions, and weekly market changes through September 9.
Southern California Industrial · Data through September 9, 2026
The Hundreds Report and Owner-User Report
This month's reports cover industrial lease options of at least 100,000 square feet and buildings for sale from 10,000 to 200,000 square feet across Los Angeles, Orange County, and the Inland Empire.
The August reports provide the starting point. We paired them with the complete September 9 CoStar availability and for-sale surveys, the latest weekly change reports, and recent lease and sale transactions to show the size of each market, what changed, and what actually closed.
01 · The Hundreds Report
100,000 SF and Larger for Lease
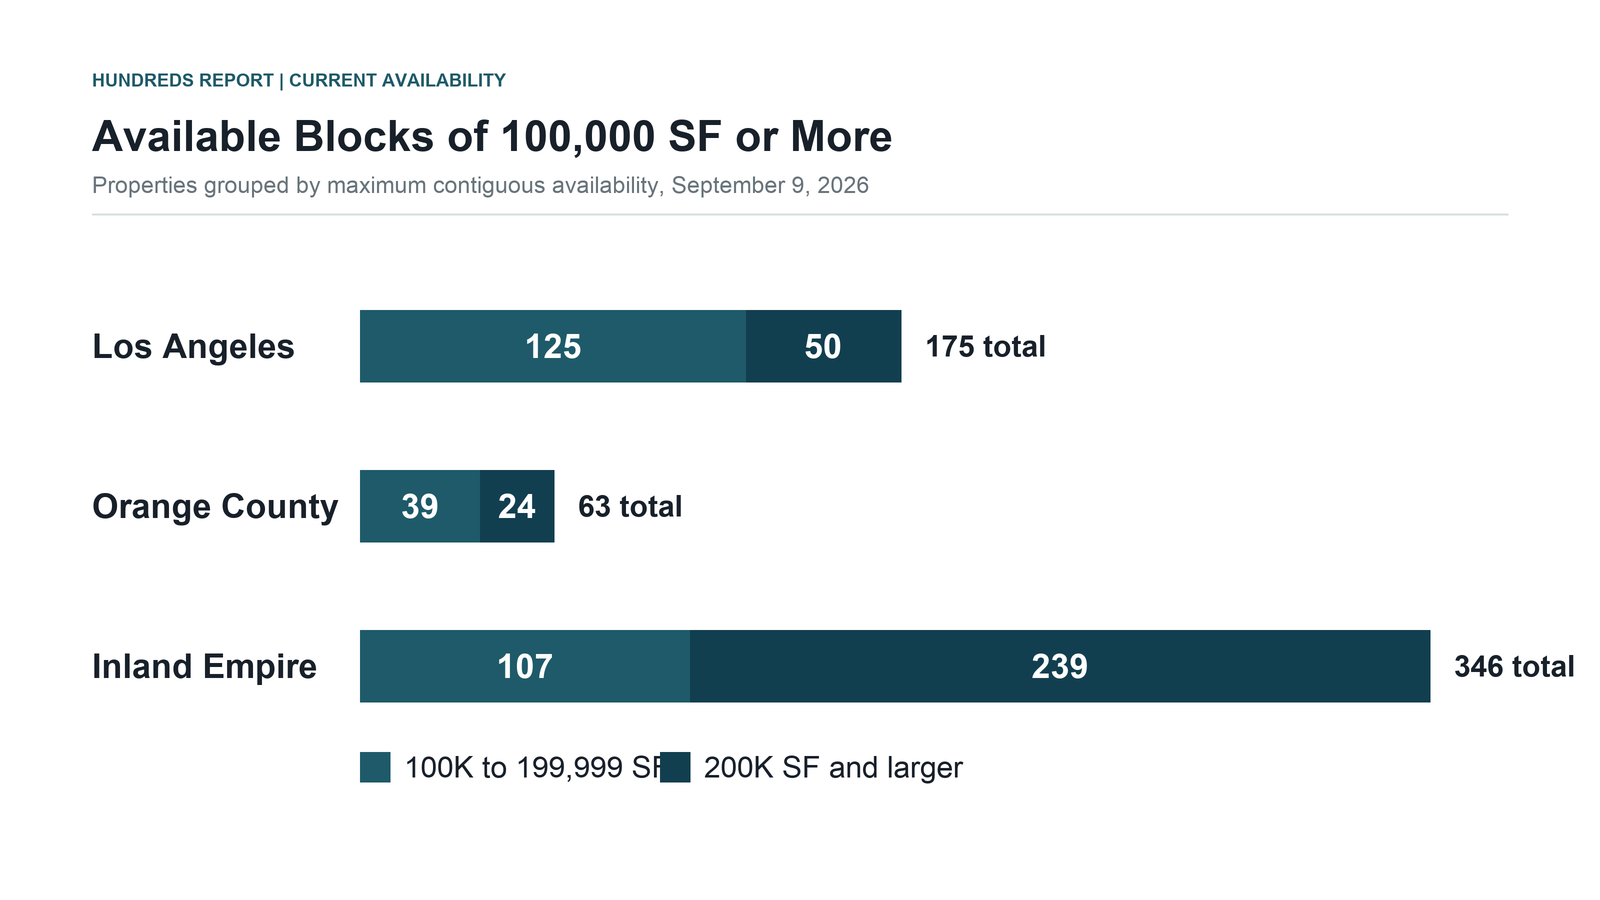
$1.40 average ask
$1.47 average ask
$0.98 average ask
Los Angeles has the most options between 100,000 and 199,999 square feet. Orange County remains the smallest large-block market, while most of the Inland Empire's available options are 200,000 square feet or larger.
| Market | Direct | Direct ask | Sublease | Sublease ask |
|---|---|---|---|---|
| Los Angeles | 110 | $1.40 | 30 | $1.28 |
| Orange County | 51 | $1.47 | 3 | $0.90 |
| Inland Empire | 106 | $0.98 | 26 | $0.95 |
What this means for tenants
If your lease expires in 2027 or 2028, compare a renewal with buildings that meet your operating requirements and can be ready before your move date. Asking rent is only the starting point. Free rent, improvements, operating expenses, move costs, and building fit can change the result.
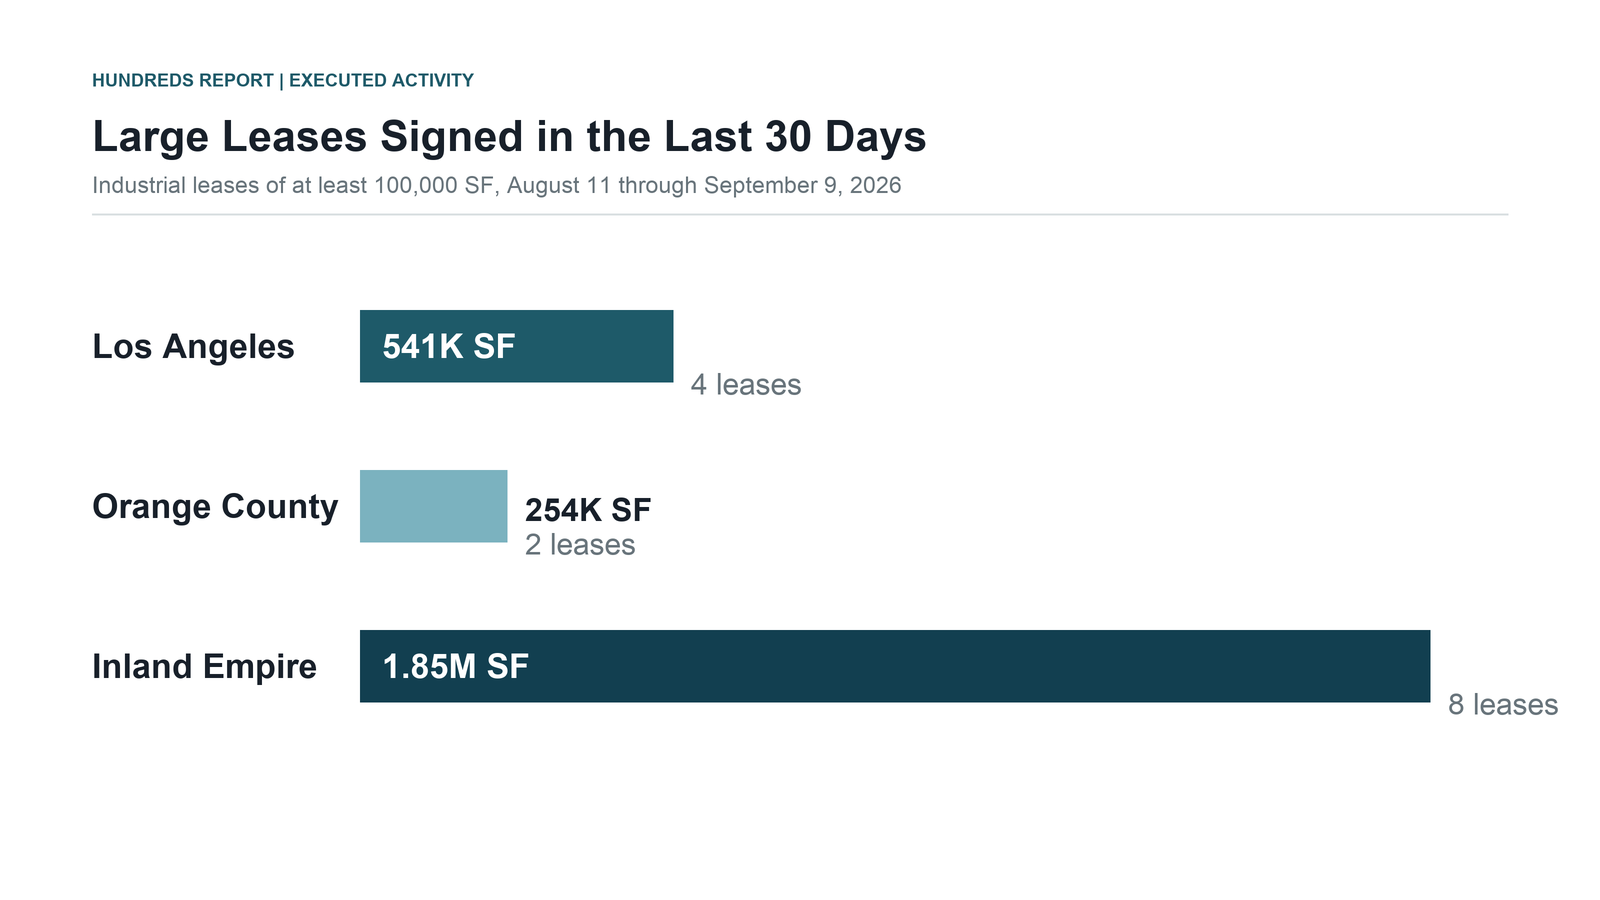
What changed from September 3 through September 9
Across the 100,000 to 200,000 square foot change reports, Los Angeles added five direct listings totaling approximately 755,000 square feet. A 123,763 square foot Commerce listing was withdrawn and returned four days later, leaving approximately 631,000 square feet of reported net additions. Three Carson buildings accounted for approximately 439,000 square feet of the new availability.
Orange County recorded no direct or sublease additions after September 2. The Inland Empire added a 146,273 square foot direct option in Rancho Cucamonga and a 113,050 square foot sublease in Corona.
One lease worth noting
CoStar reports that Norman S Wright Climatec Mechanical Equipment leased 132,231 square feet at 3335 East La Palma Avenue in Anaheim. The 10-year, 3-month lease starts at $1.60 per square foot per month, triple net, with three months free and 3.5 percent annual increases. CoStar reports an effective rent of $1.80 per square foot per month. The deal shows why tenants should compare starting rent, concessions, increases, and effective rent together.
02 · The Owner-User Report
10,000 to 200,000 SF for Sale
three size bands
three size bands
three size bands
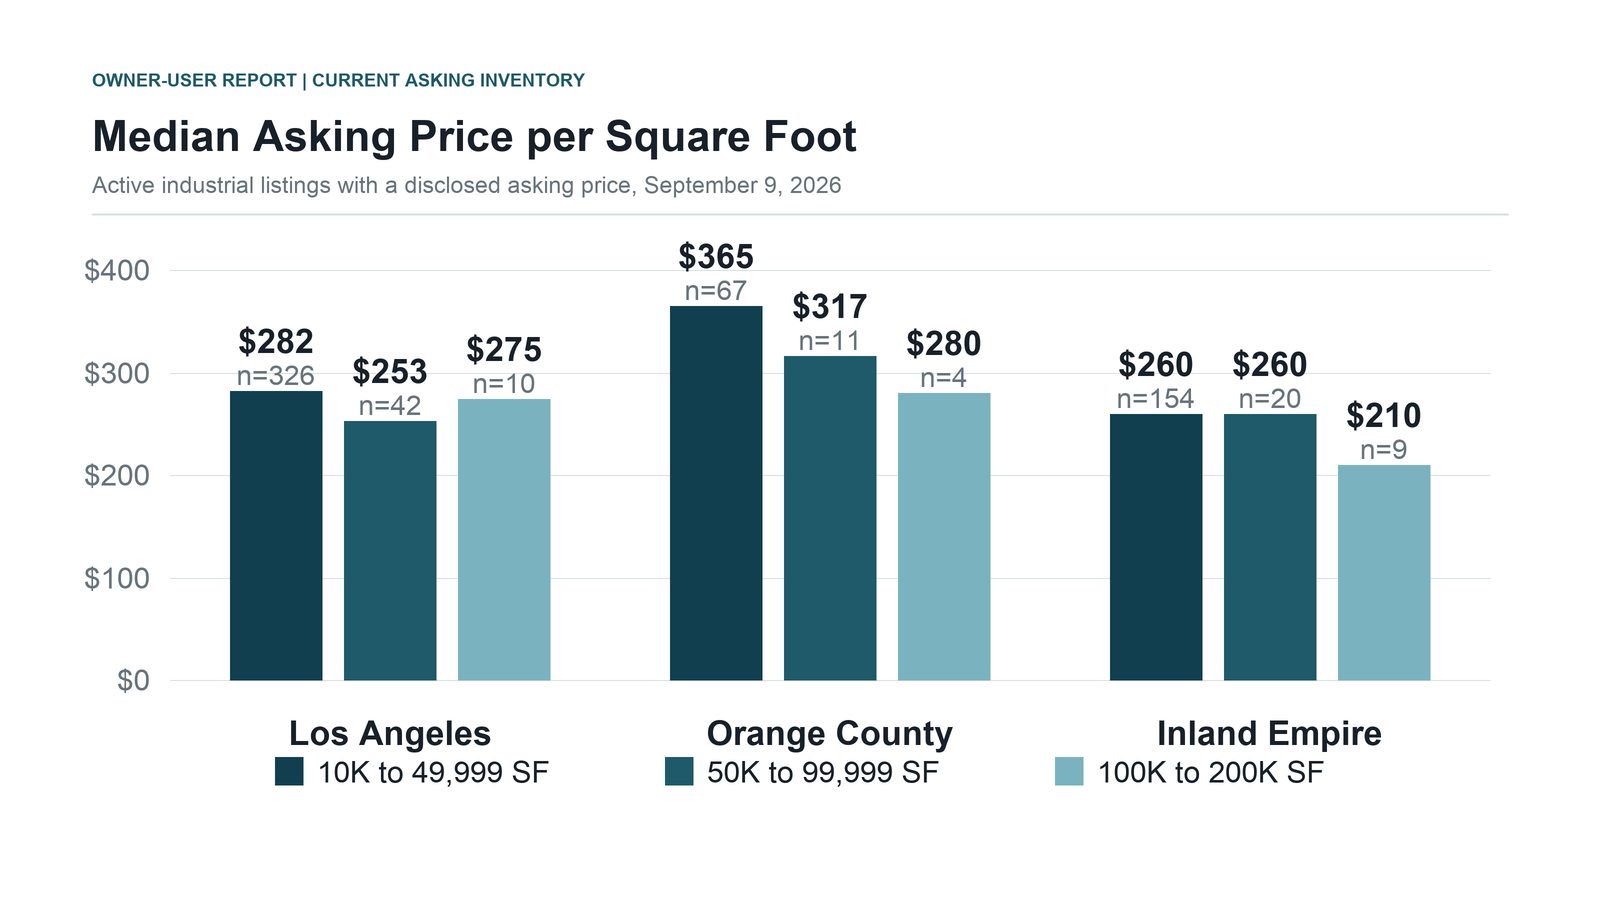
The September 9 survey provides a newer inventory snapshot, although its classifications differ from the August report. It identifies 533 listings between 10,000 and 200,000 square feet in Los Angeles. Orange County has 128 listings. The Inland Empire has 296 listings.
Among listings with a disclosed asking price, the current median across the full size range is approximately $275 per square foot in Los Angeles, $360 in Orange County, and $260 in the Inland Empire. These medians are screening benchmarks. A building's location, condition, occupancy, and usable space determine whether it is truly comparable.
| Market | 10K to 50K | 50K to 100K | 100K to 200K |
|---|---|---|---|
| Los Angeles | 416 | $289 | 70 | $253 | 31 | $259 |
| Orange County | 90 | $374 | 21 | $369 | 11 | $310 |
| Inland Empire | 218 | $249 | 54 | $251 | 39 | $256 |
August report: each cell shows the listing count and average asking price per square foot.
What this means for owner-users
More listings create a better screening opportunity, but asking prices do not tell you where deals are closing. A useful buy-versus-lease comparison should include current sale comps, financing, occupancy timing, improvements, and the cash required after closing.
What changed from September 3 through September 9
In Los Angeles, four properties recorded seven separate asking-price reductions totaling approximately $1.76 million, an 8.6 percent weighted reduction across those listing records. In Orange County, the asking price at 1661-1701 South State College Boulevard fell from $19.47 million to $16.9 million. In the Inland Empire, 1822 East Francis Street fell from approximately $27.92 million to $25.04 million.
The Los Angeles total combines several listing records, while the Orange County and Inland Empire examples each describe one property. Together, they identify owners who have already adjusted pricing and may offer buyers a more productive starting point for negotiations.
How to read the sale comps
Recent sales vary widely by submarket and building profile, and many do not disclose whether the buyer was an owner-user or an investor. That makes a well-matched property example more useful than a blended regional average.
One sale worth noting
CoStar reports that the 40,385 square foot industrial building at 201 West 138th Street in Los Angeles sold on September 8 for $7.34 million, or approximately $182 per square foot. The CoStar record lists an $8.75 million asking price and 319 days on market, putting the closing price approximately $1.41 million, or 16 percent, below the ask. Buyers can use that property-level history to frame an offer around the building, the asking-price history, and the seller's time on market.
From the desk
Which buildings fit your next move?
Reply with your preferred area, approximate square footage, and timing. We can narrow the current inventory, identify the closest recent transactions, and compare the realistic lease and purchase options.
Senior Vice President and Principal
Lee & Associates | Irvine
jbsmith@leeirvine.com | 949.400.4786
Sources
Source: Lee & Associates Southern California Industrial Hundreds Report and Owner-User Report, August 2026, plus the complete CoStar availability and for-sale surveys, weekly change reports, and lease and sale comparable exports through September 9, 2026. The August report totals and September 9 survey counts use different classifications and are identified separately. The weekly lease changes cover the 100,000 to 200,000 square foot range. Asking rents are quoted per square foot per month using the service type shown in the reports. Transaction terms reflect information reported by CoStar and should be independently verified.