Industrial Insights Newsletter
Industrial Insights - Q3: Where Do Tenants Still Have Leverage?
Q3 by the numbers: vacancy turned down in all three markets, where building size gives tenants leverage, and why Rexford's new tenants got the better deal.
In Q3 the answer depended more on building size than on county. In Orange County and the Inland Empire, space under 50,000 SF is the tightest segment, while buildings from 100,000 to 500,000 SF give tenants far more choice.
01 · Q3 Market
Vacancy turned down in all three markets
CoStar's Q3 data shows Q2 2026 was the highest vacancy of this cycle in Orange County, Los Angeles and the Inland Empire. In Q3, all three fell together for the first time since 2021.
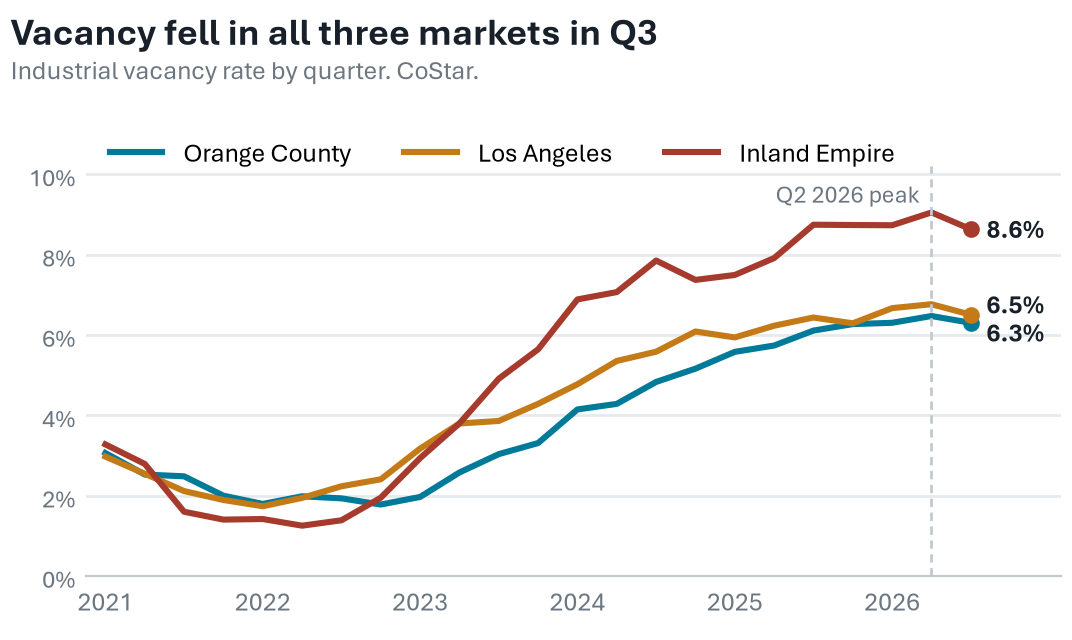
- Los Angeles fell from 6.8% to 6.5%, the Inland Empire from 9.1% to 8.6%, and Orange County from 6.5% to 6.3%.
- Orange County's 12-month net absorption turned positive, +1.38 million SF, after 13 straight negative quarters.
My read: one quarter is not a trend, but the direction changed. If your lease expires in 2027, the best terms of this cycle may already be on the table.
Your options are bigger than vacancy shows
Vacancy counts empty space. Availability also counts space being marketed while the current tenant is still in it, typically because a lease is ending or the tenant is subleasing. If you are moving in the next 12 to 18 months, availability is the better guide to what you will be able to tour.
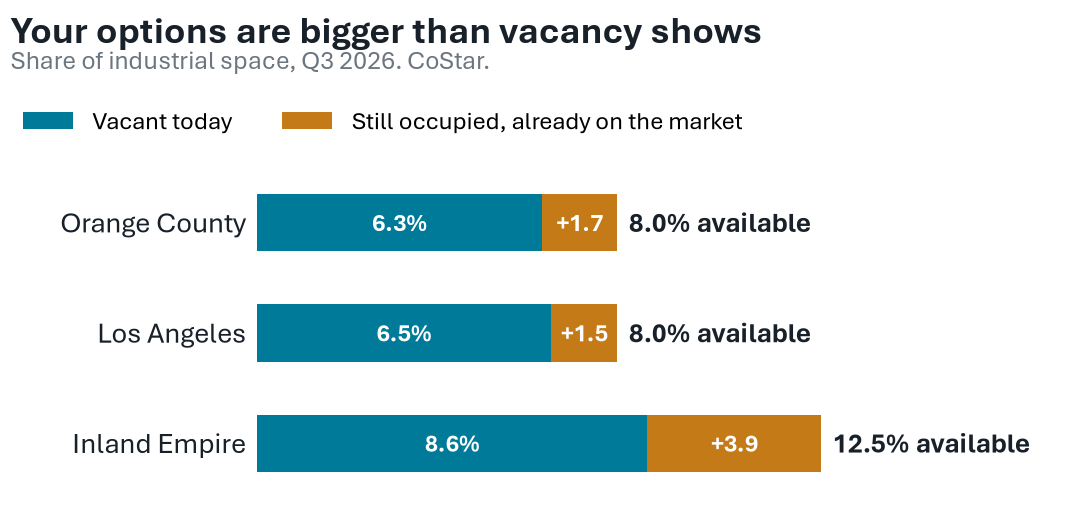
- Inland Empire: 3.9 points of its 12.5% availability is space still occupied, up from 3.0 a year ago. Sublease space rose to 17.1 million SF from 15.0 million in Q2.
- Los Angeles: sublease space fell to 10.3 million SF, down from 13.8 million SF at the end of 2024.
- Orange County: a 1.7-point gap, with 3.7 million SF of sublease space.
My read: if your move is 12 to 18 months out, start from the availability list, not the vacancy rate. Many of the buildings you will choose from are still occupied today.
Where building size gives you leverage
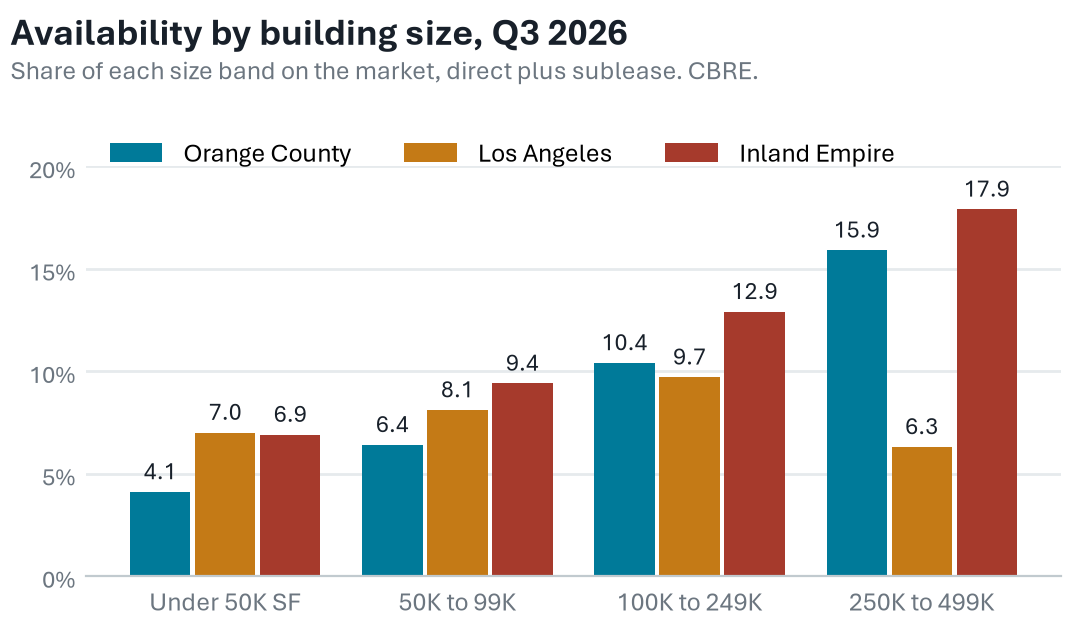
- Under 50,000 SF is the tightest band in Orange County (4.1% available) and the Inland Empire (6.9%).
- From 250,000 to 499,999 SF, availability runs 15.9% in Orange County and 17.9% in the Inland Empire.
- Los Angeles is the exception: that band is 6.3% available, tighter than its small buildings.
Q3 detail by market
Orange County · CBRE, Q3
- 4.1 million SF leased, up 58% from Q2 and the best quarter since Q4 2023. Net absorption was +280,000 SF.
- Aerospace and defense led with more than 500,000 SF of new leases.
- Anduril took two new buildings in the Airport Area, now the tightest submarket at 3.2% vacant. Glenair signed the largest lease, over 237,000 SF in North Orange County.
- Asking rent rose to $1.51, but the average taking rent fell to $1.47 from $1.53.
- Free rent on five-year deals fell to 2.6 months from 3.6.
My read: landlords are giving on base rent and pulling back free rent. Compare total cost over the term, not the face rate.
Los Angeles · CBRE, Q3
- Fourth straight quarter of positive net absorption: 1.91 million SF.
- 13.67 million SF leased in Q3, and 43.3 million SF this year, up 19.4%.
- Buildings of 250,000 SF and up absorbed 4.91 million of the 5.09 million SF gained this year. Buildings under 50,000 SF gave back 1.43 million SF.
- Expeditors leased 429,000 SF in Carson. The largest deal was a 522,000 SF renewal in Compton.
- Asking rent held at $1.19 after falling in 10 of the prior 11 quarters, 30% below Q3 2023.
My read: the recovery is in big buildings. Small-bay tenants still have options, and 1.42 million SF of speculative space delivers in Q4.
Inland Empire · CBRE, Q3
- 17.2 million SF leased, but new leasing fell 28% from Q2's record.
- Taking rent fell 3.8% to $1.01 while asking held at $1.08. In IE West, taking rent dropped 5.4% in one quarter to $1.05.
- Georgia-Pacific and Kumho Tire vacated 1.8 million SF in Rancho Cucamonga. Three 3PL leases over 400,000 SF filled 1.6 million SF.
- Wayfair renewed 2 million SF in Perris and Converse 656,000 SF in Ontario.
- Net absorption was +1.00 million SF. The pipeline grew 34.8% to 8.3 million SF: 80% speculative, 62% in buildings of 500,000 SF and up.
My read: for tenants between 100,000 and 500,000 SF, the negotiating window is open. Landlords are cutting taking rents to land credit tenants.
See the options behind these numbers · Free downloads
Download the Hundreds Report
Download the Owner-User Report
Prepared every month by our team. Free to download and share.
02 · Rexford Industrial
Rexford's occupancy increased. New tenants got the better deal.
| New leases | Renewals | |
|---|---|---|
| Starting cash rent, per SF per month | $1.19 | $1.21 |
| Prior tenant's rent, same space | $1.28 | $1.21 |
| Change | −7.0% | +0.1% |
| Free rent | 5.6 mo. | 2.7 mo. |
| Improvements, one time per SF | $1.94 | $2.92 |
| Average term | 6.5 yrs | 4.6 yrs |
| Leases signed | 60 | 56 |
| Square feet | 2.16M | 1.58M |
Rexford Q3 2026 supplemental. Rents converted from annual to monthly; percent changes are Rexford's.
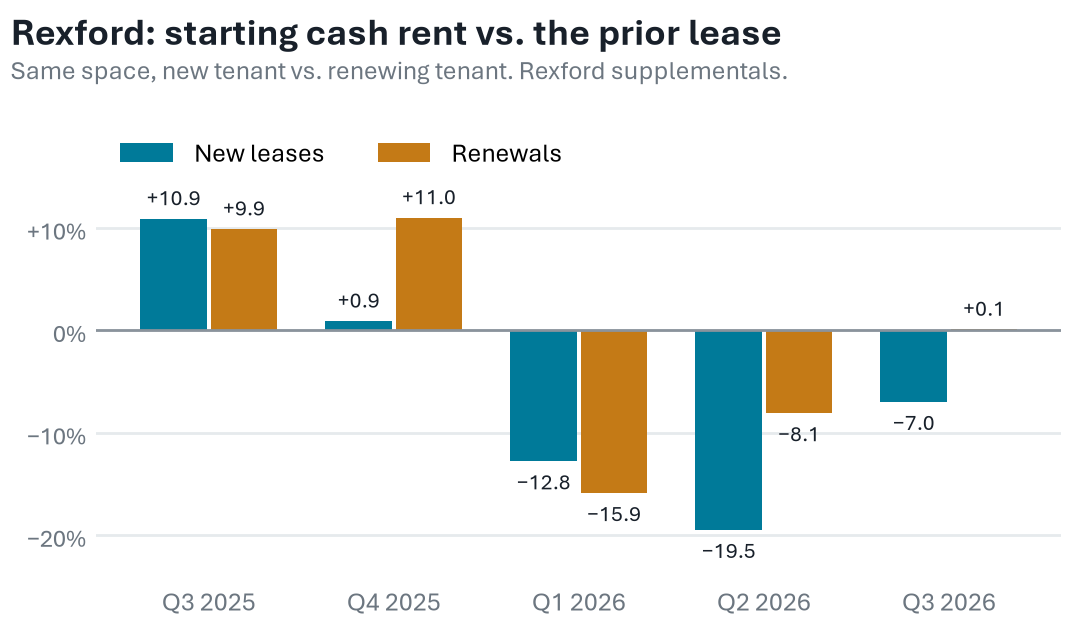
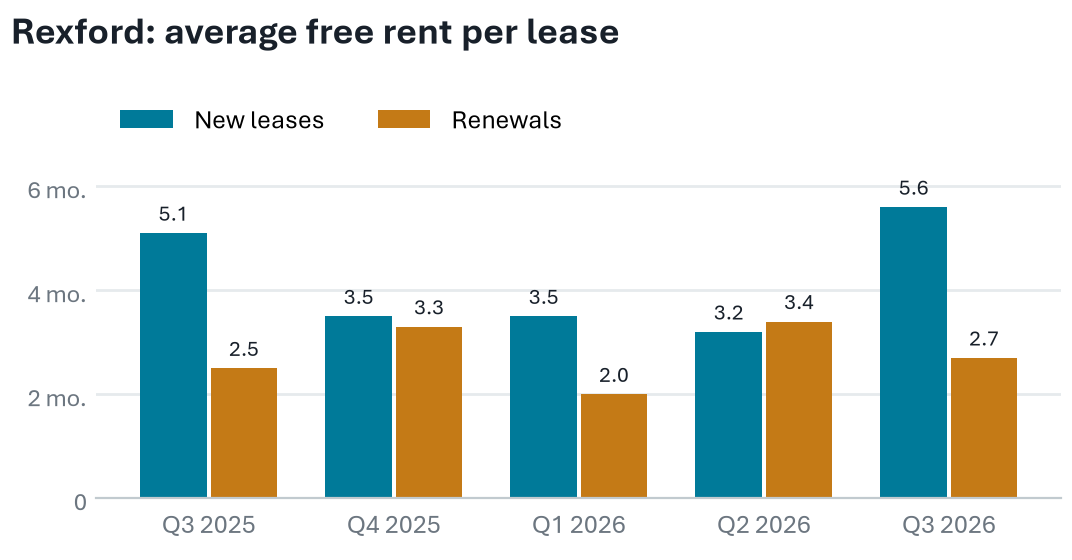
My read: renewing tenants paid the prior rent. New tenants started 7% lower with twice the free rent. If your lease expires in the next 18 months, price a move before you sign a renewal.
- The discount is shrinking: new-lease rents were 19.5% below the prior tenant in Q2 and 7.0% below in Q3.
- Rexford is also selling. It has sold 6.35 million SF for $1.53 billion this year and raised its 2026 sales target to $1.7 to $2.0 billion, from $1.5 to $2.0 billion.
- Three Q3 sales went to owner-users: 251,280 SF for $86.0 million, about $342 per SF.
- Portfolio occupancy rose fastest in the Inland Empire, 86.9% to 91.7%, and Orange County, 91.8% to 95.1%.
03 · Conversations
Recent conversations
- Marty Shiff, Rooflifters. When raising the roof on an existing building pencils out: feasibility, budgets, loading and slabs.
- Jeff Janda, Lee & Associates Chicago. Chicago industrial lease costs today, and how he built Lee's Chicago office.
- Craig Fuller, FreightWaves. Why more freight can move through existing warehouses without creating demand for another building.
- Lisa Anderson, LMA Consulting Group. The capacity, production and power questions to answer before you commit to a bigger building.
- Craig Hagglund, SIOR, Lee & Associates Oakland. Working the I-880 corridor since 1989, and what is driving Northern California industrial now.
- Troy Wisse, Lee & Associates New Jersey. How he built a top industrial team in Northern New Jersey and develops the next generation of brokers.
- Dr. Rob Handfield, NC State University. A supply chain scholar on flow, fragility and what they mean for industrial real estate.
- Bill Shopoff, Shopoff Realty Investments. Four decades of entitlement cycles, and how CEQA lawsuits ended up timing the 2021 peak.
- Jack Cline, Lee & Associates Downtown Los Angeles. L.A. industrial since 1983: more buildings for sale in Vernon and Commerce, energy and data centers.
- Rob Gramlich, Grid Strategies. Why utilities are telling new manufacturers and data centers to wait five or six years for power.
- Travis Wood, Lee & Associates Charlotte. From Prologis to brokerage, building a pipeline, and the Charlotte industrial market.
Renew, relocate or buy?
Reply with your city, building size and timing, and I'll show you where your size band sits in these numbers and what comparable deals are getting today.
Lee & Associates | Irvine
jbsmith@leeirvine.com · 949.400.4786
Sources
CoStar market data (vacancy, availability, sublease and net absorption); CBRE Research, Q3 2026 Figures for Orange County, Los Angeles and Inland Empire industrial; Rexford Industrial quarterly supplementals, Q3 2025 to Q3 2026, and Q3 2026 results release (October 22, 2026); Lee & Associates Irvine October 2026 Hundreds and Owner-User Reports. Rexford rents converted from annual to monthly. “My read” is my interpretation.