Industrial Insights Newsletter
Industrial Insights - More Options, Uneven Leverage
What's available, where asking rents have fallen, and what to check before your next lease decision.
CoStar just dropped its latest State of the Market presentations, and they are chock-full of great data that helps refine our view of the Southern California industrial real estate market.
These eleven charts take a closer look at Los Angeles, Orange County, and the Inland Empire, with particular attention to the differences that can affect your next deal.
01 · New leasing
Record New Leasing in LA and the Inland Empire
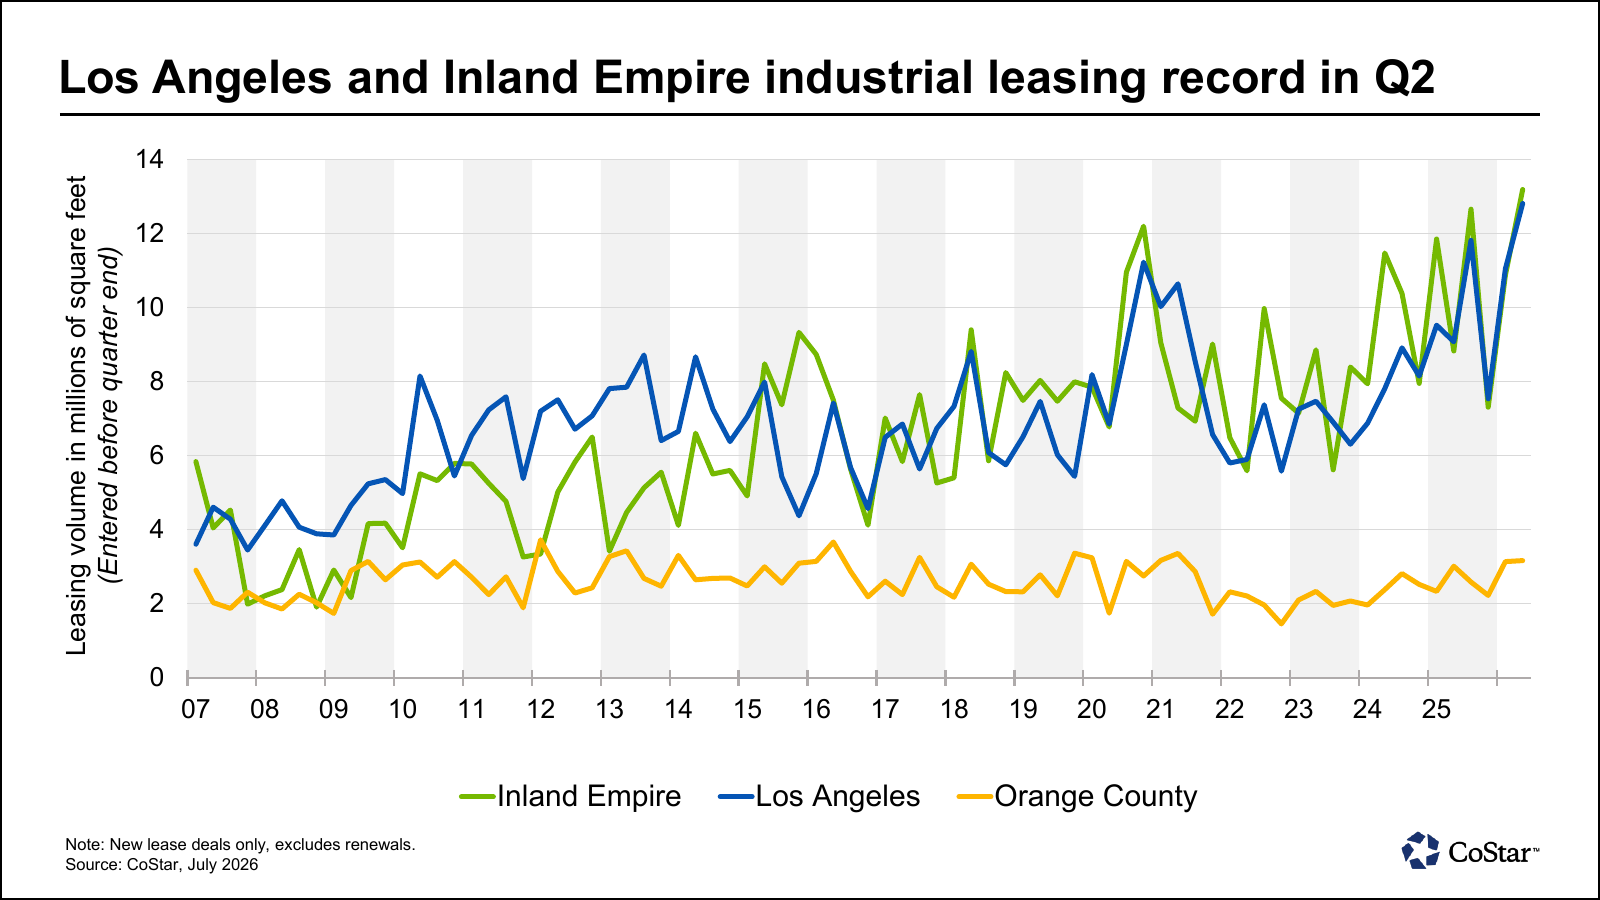
Los Angeles recorded its highest new-leasing volume in the series, Orange County activity strengthened, and the Inland Empire also reached a series high. These figures exclude renewals.
02 · National ranking
Only Dallas-Fort Worth Leased More
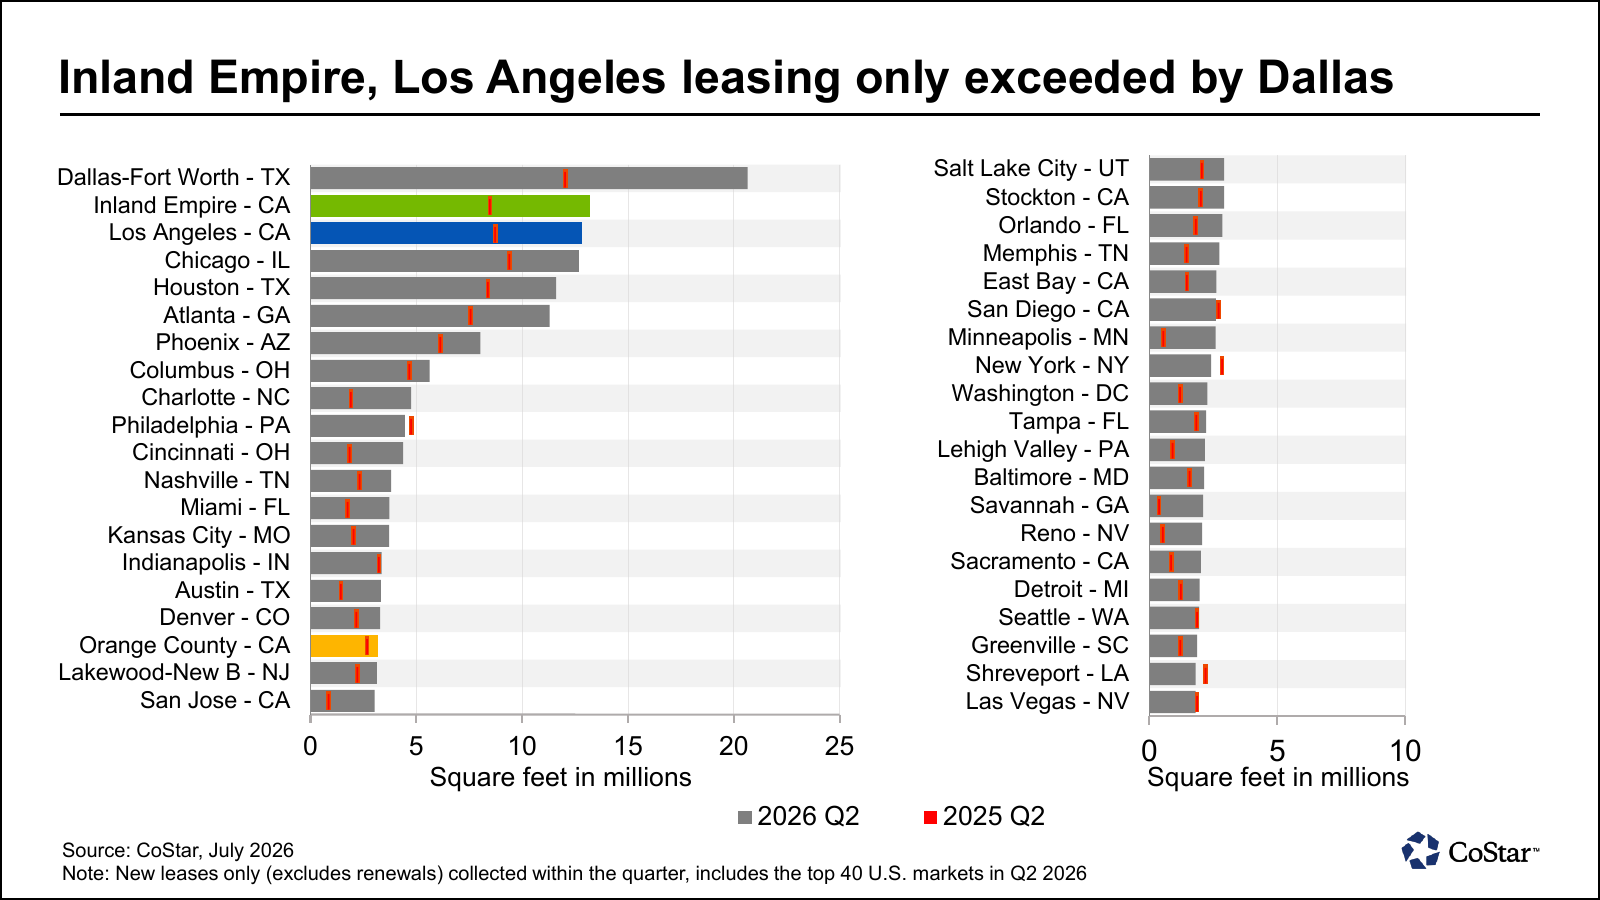
Los Angeles and the Inland Empire were behind only Dallas-Fort Worth in Q2 new-leasing volume, excluding renewals. Southern California remains one of the country's busiest industrial leasing markets.
03 · Regional availability
Availability Runs from 7.9% to 12.2%
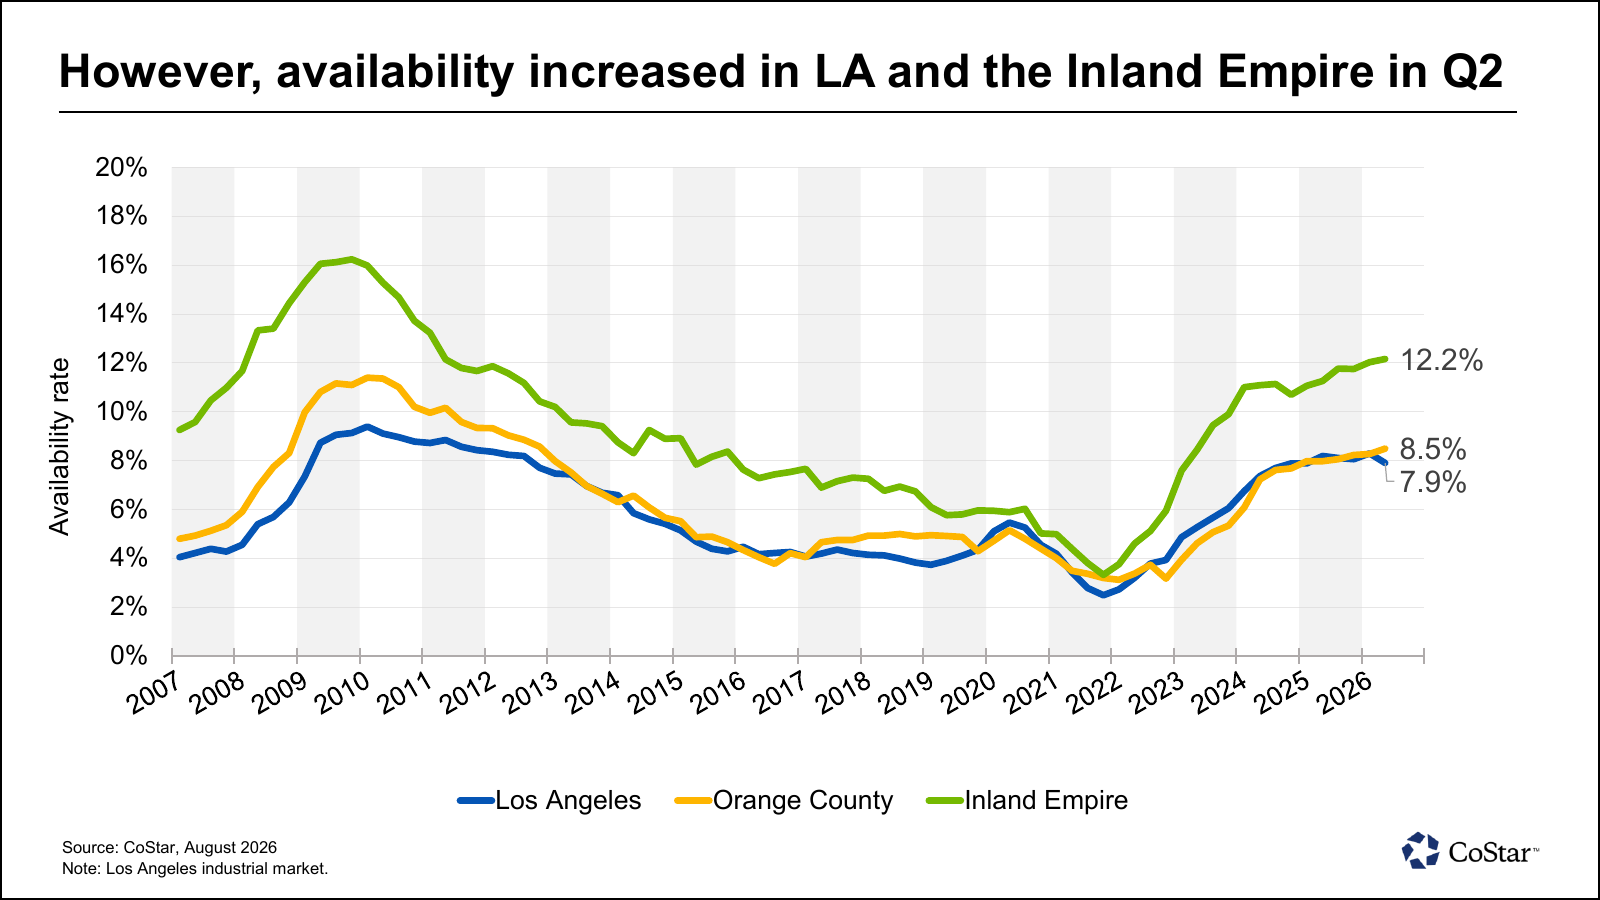
Industrial availability stands at 7.9% in Los Angeles, 8.5% in Orange County, and 12.2% in the Inland Empire. Those percentages cover a broad range of properties, including buildings that may be the wrong size or lack the loading your operation needs.
04 · Orange County availability
More Large Buildings Are Available in OC
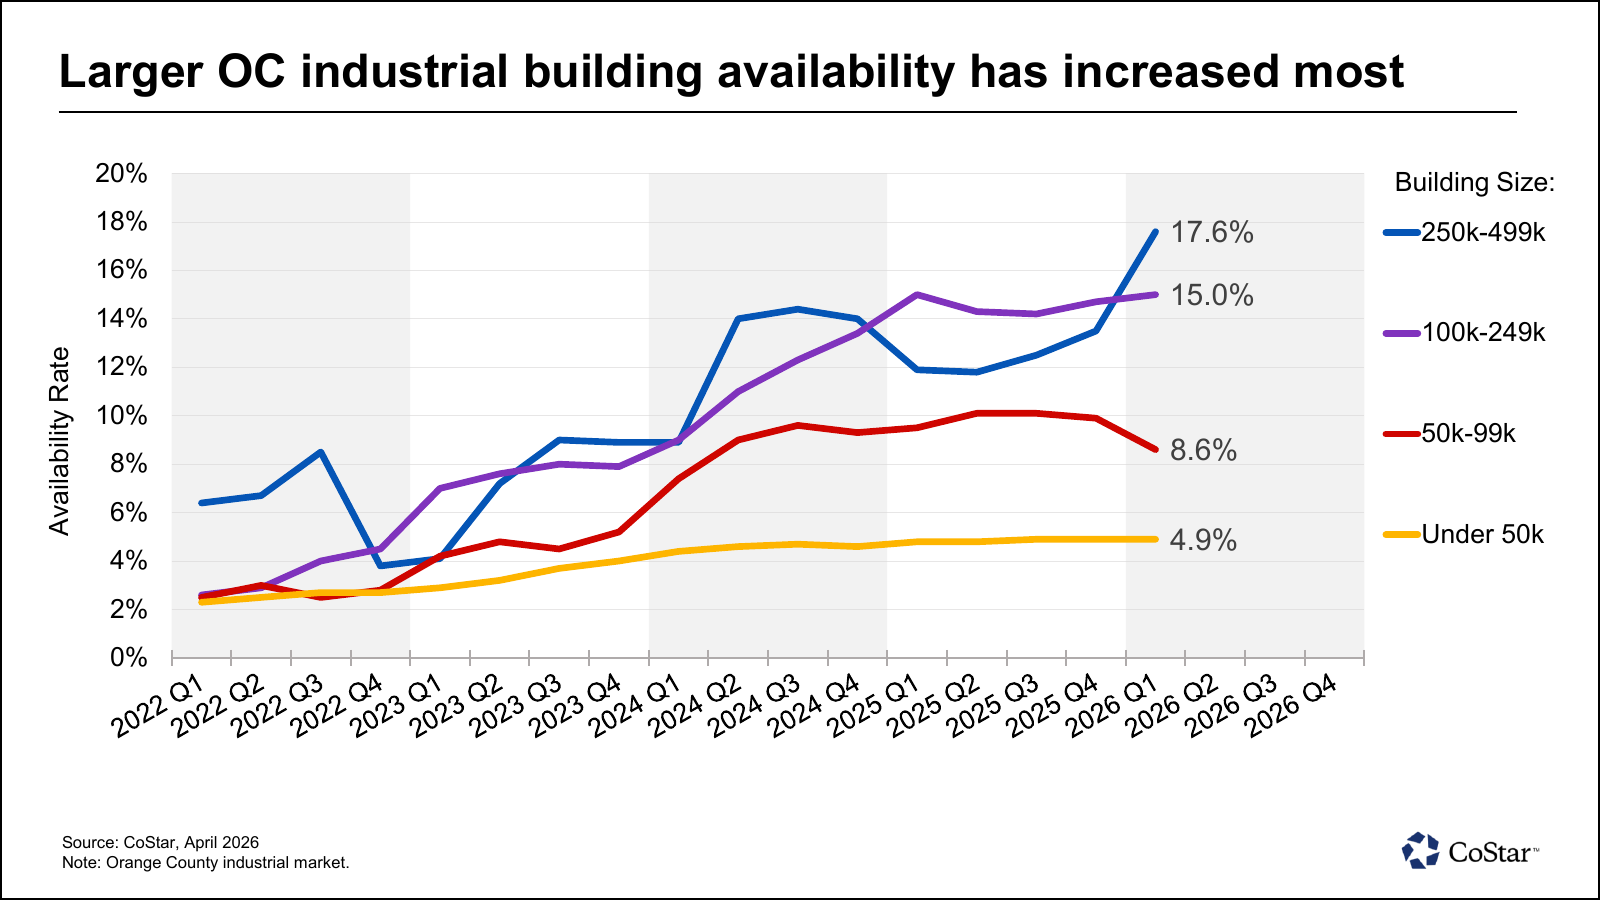
Orange County's April snapshot puts availability at 4.9% below 50,000 SF, 15.0% from 100,000 to 249,000 SF, and 17.6% from 250,000 to 499,000 SF. Companies looking for smaller spaces face a much narrower selection.
05 · Orange County pricing
OC Rent Declines Vary Sharply by Size
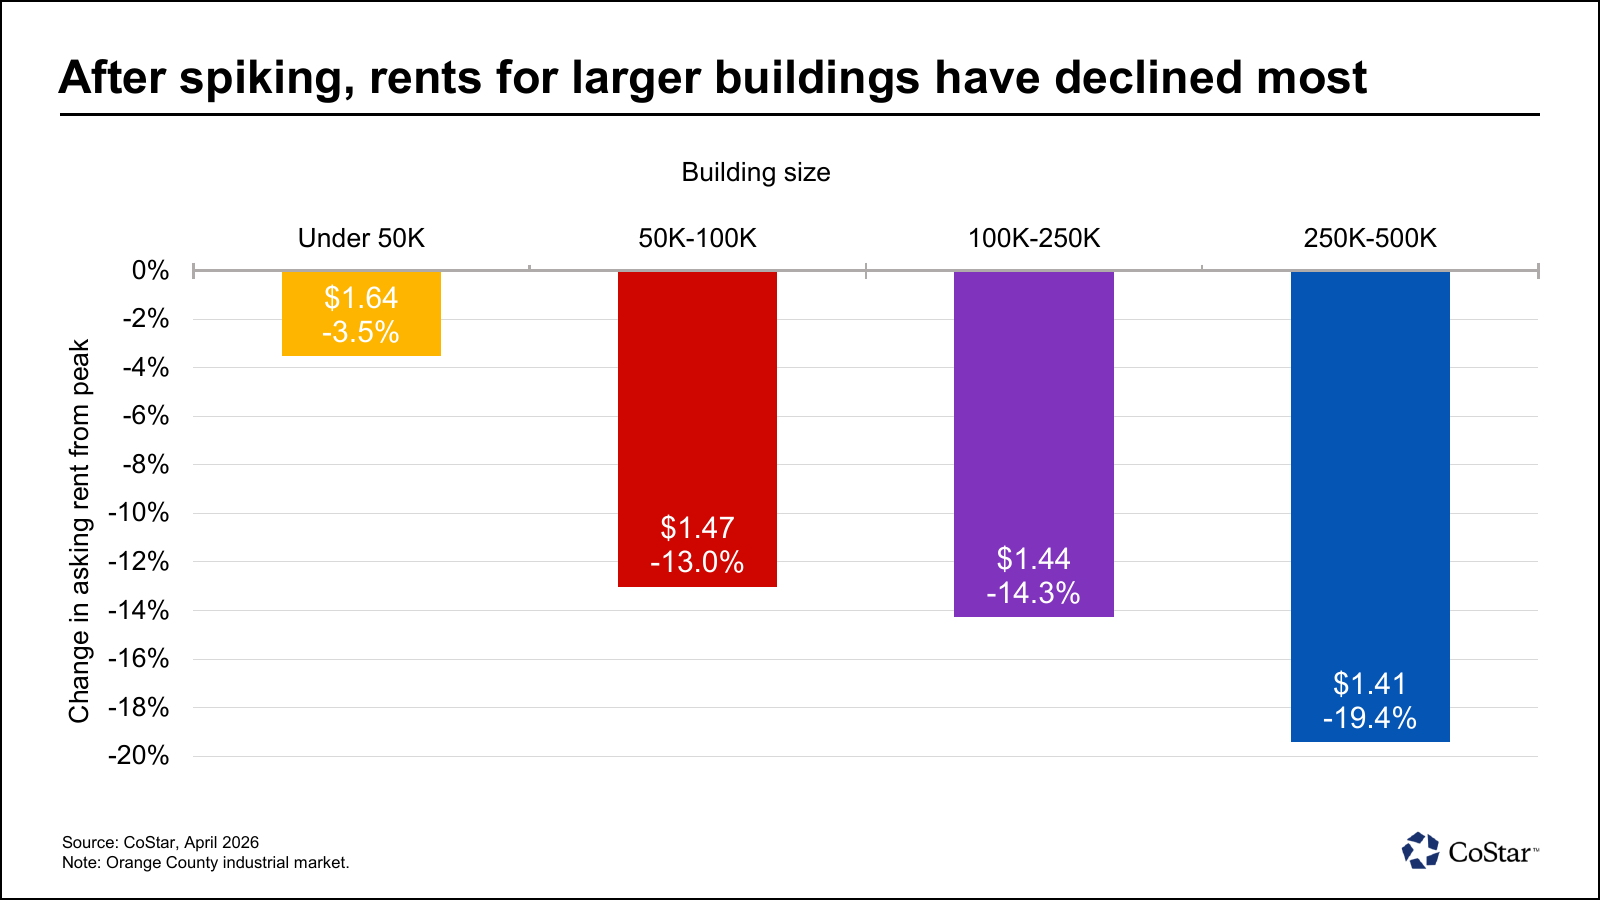
In the April data, OC asking rents are 19.4% below peak for buildings from 250,000 to 500,000 SF, compared with 3.5% below peak for buildings under 50,000 SF. A smaller-building renewal needs smaller-building comps.
06 · Inland Empire availability
IE Availability Also Varies by Size
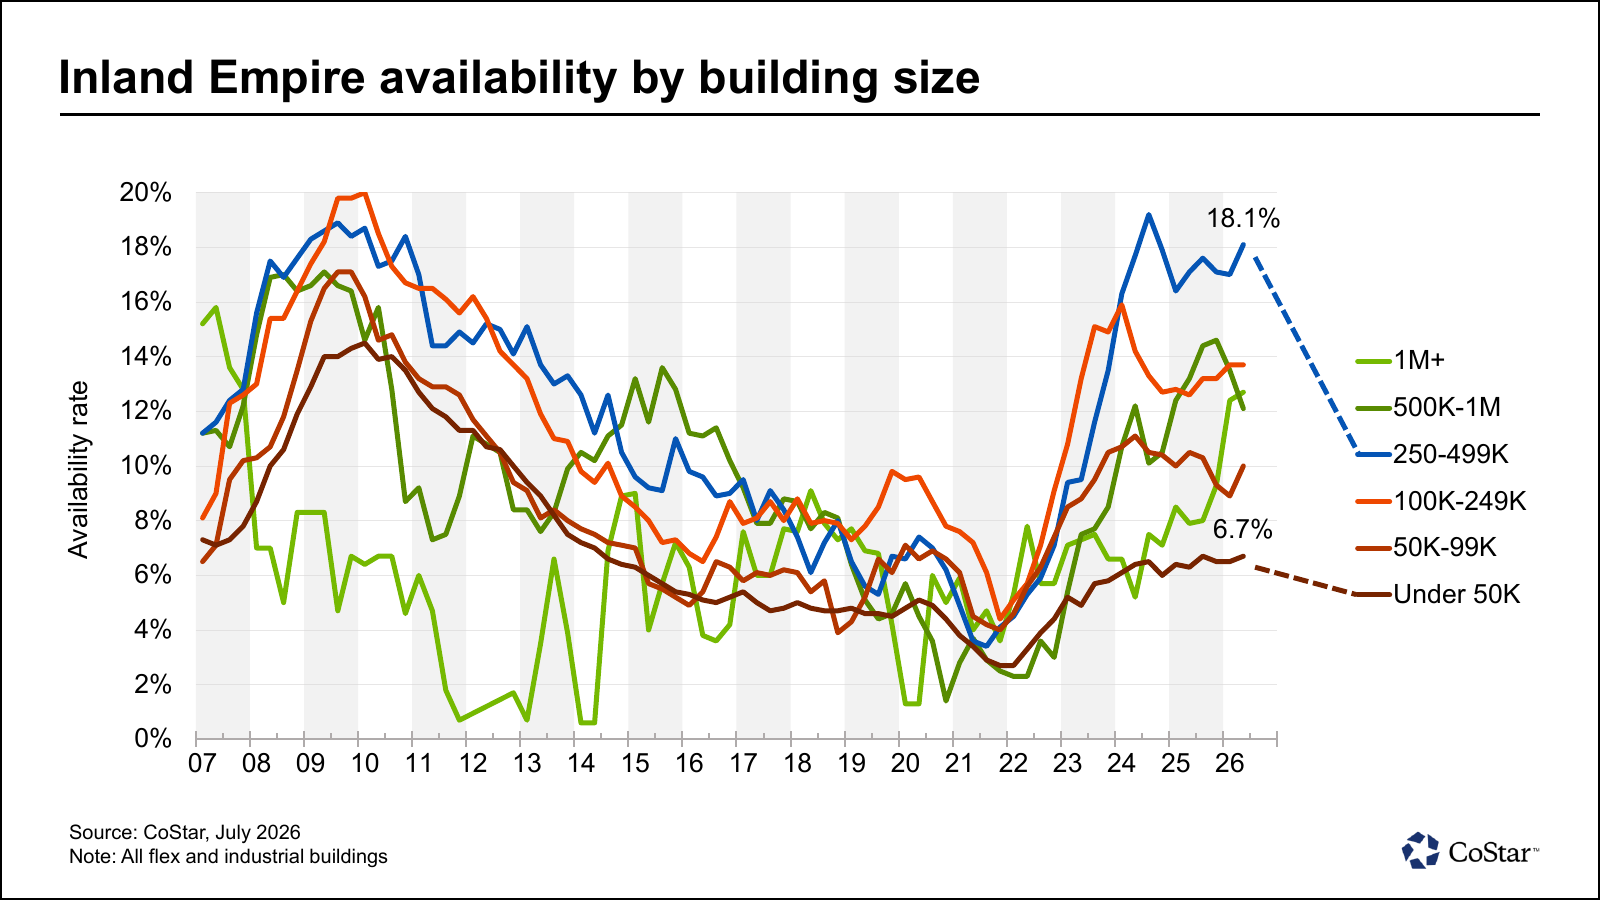
Inland Empire availability ranges from approximately 6.7% below 50,000 SF to 18.1% from 250,000 to 499,000 SF. The region's higher overall availability is more relevant to a large warehouse search than to a company seeking a small industrial building.
07 · Inland Empire supply
Recent IE Deliveries Are 31% Leased
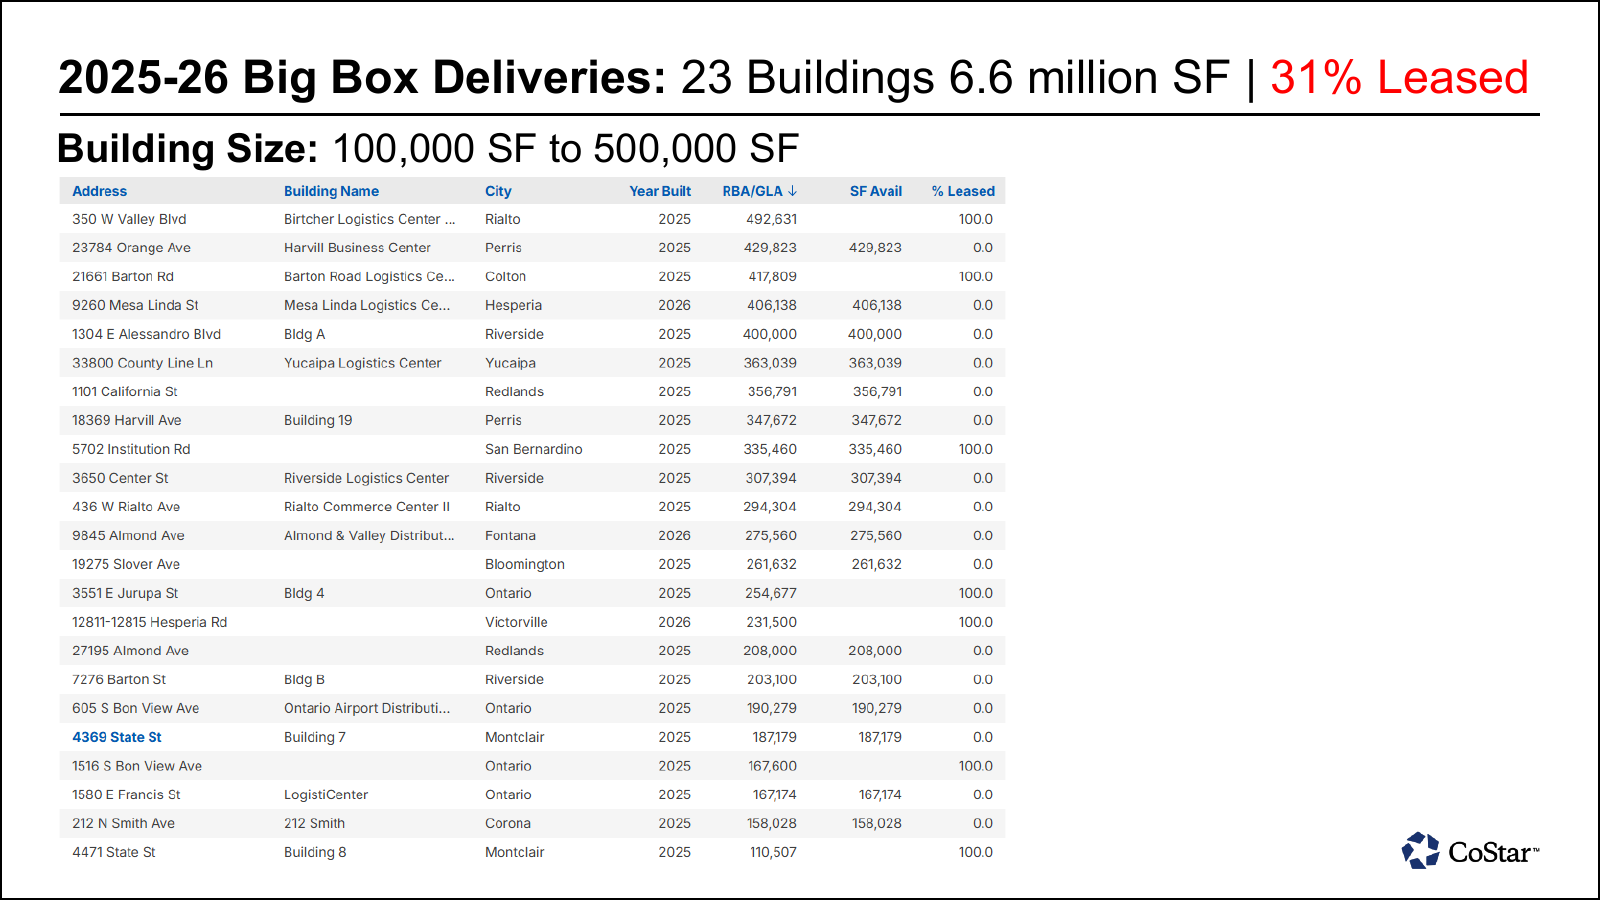
CoStar's selected group of 23 Inland Empire buildings delivered in 2025 and 2026 totals 6.6 million SF and is shown as 31% leased. That leaves a sizable group of newer buildings for companies seeking 100,000 to 500,000 SF, though availability and completion status still need to be confirmed property by property.
08 · Southern California rents
Asking Rents Remain Below Their Peaks
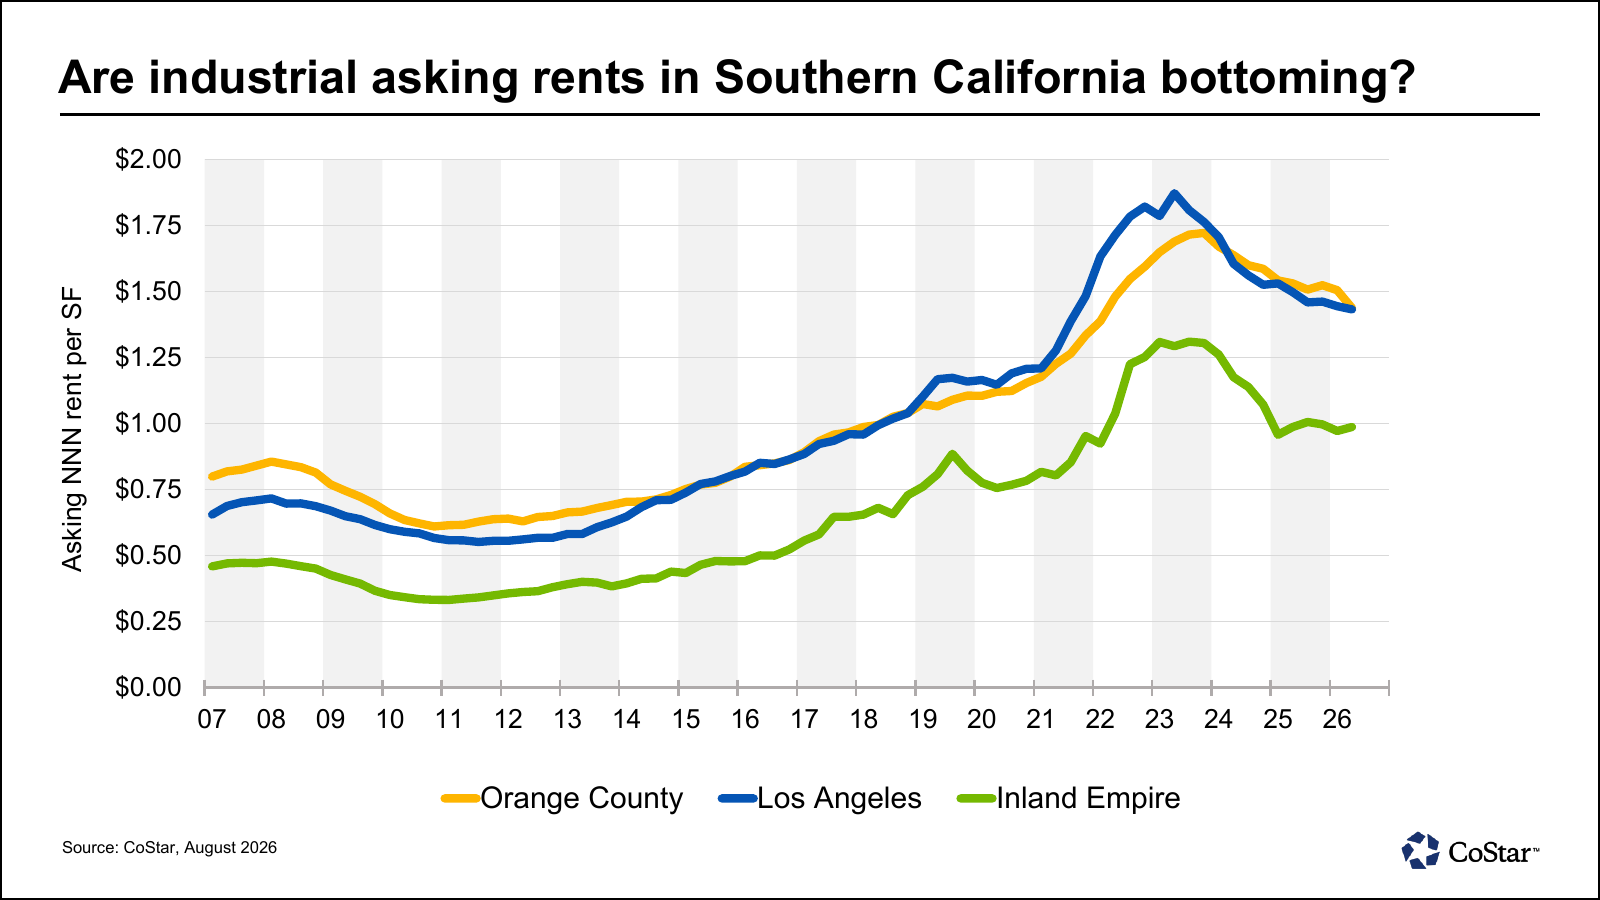
Asking rents remain below peak across Los Angeles, Orange County, and the Inland Empire. The IE line has flattened. These are asking rates, and free rent and improvement dollars can change the economics.
09 · Los Angeles supply
LA Construction Is Down 55%
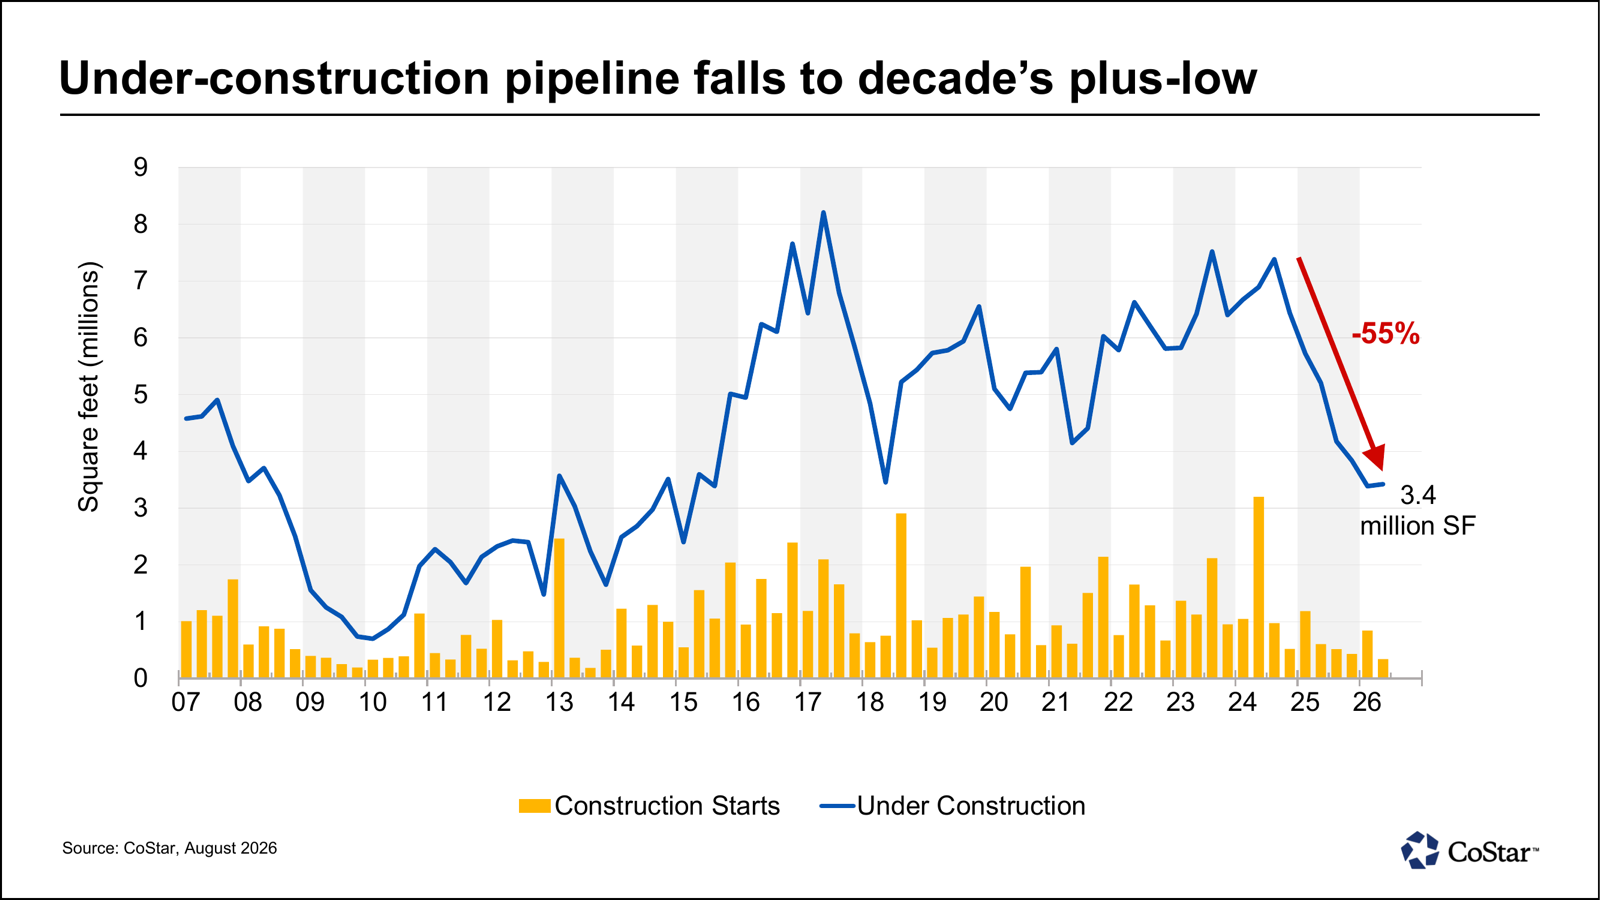
Los Angeles has approximately 3.4 million SF under construction, down 55% from the recent high and near its lowest level in more than a decade. The August snapshot points to substantially less new space in the pipeline.
10 · Owner-user purchases
OC For Sale Inventory Is the Highest Since 2014
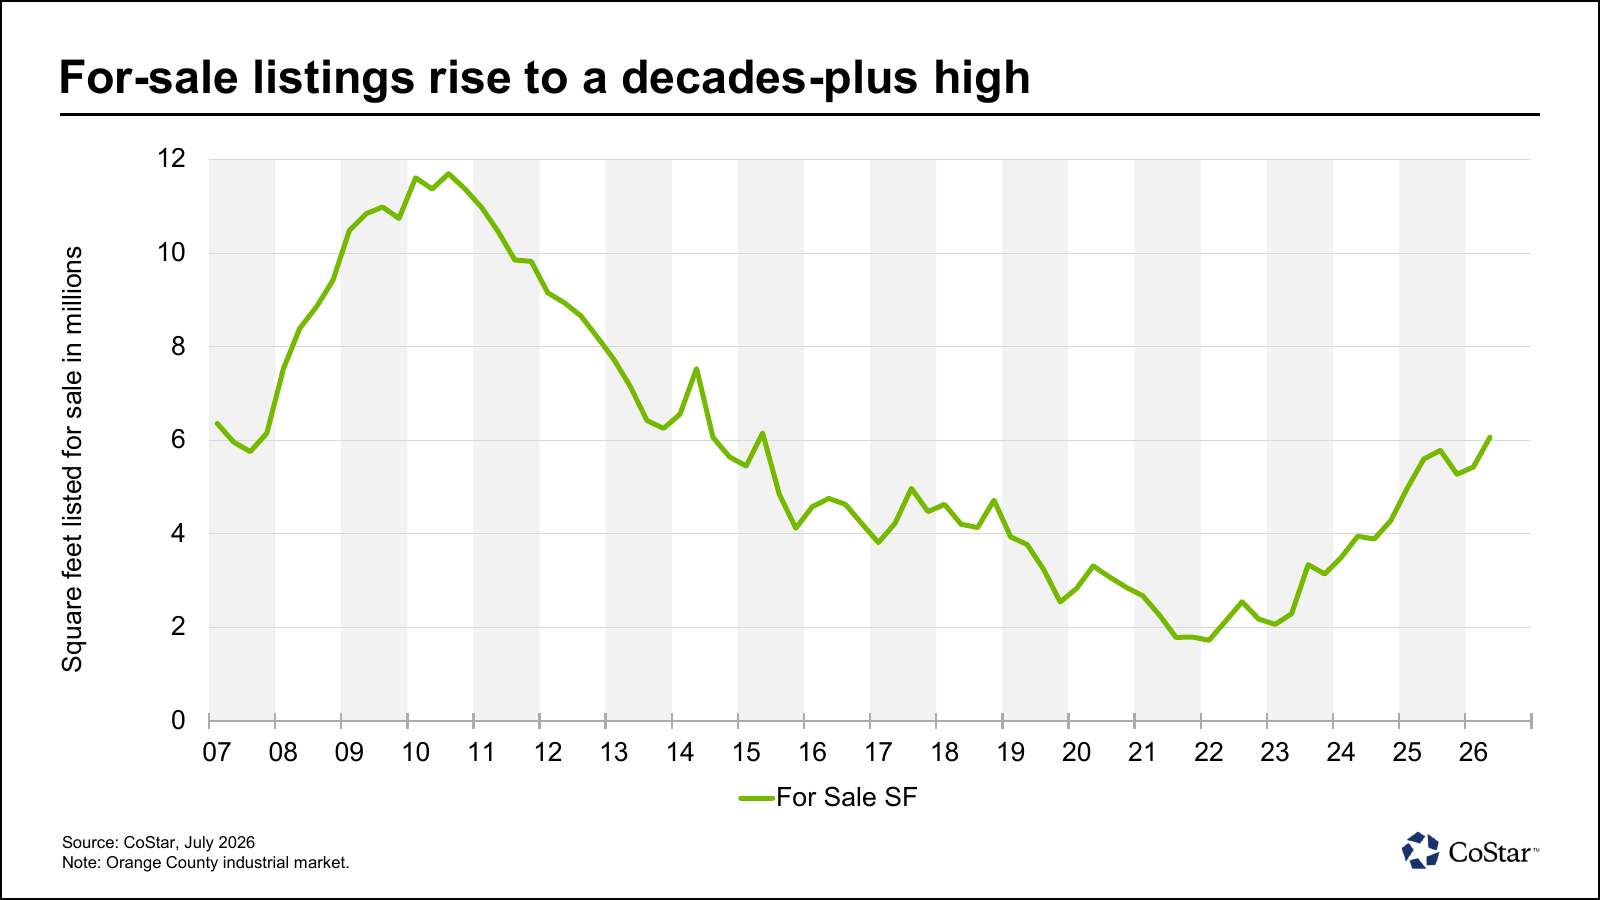
About 6 million SF of Orange County industrial space is listed for sale, the highest level in more than a decade. Owner-users have more buildings to review, though many will fall away once you screen for building function and occupancy timing.
11 · Timing
LA Properties Take About 4.7 Months to Lease
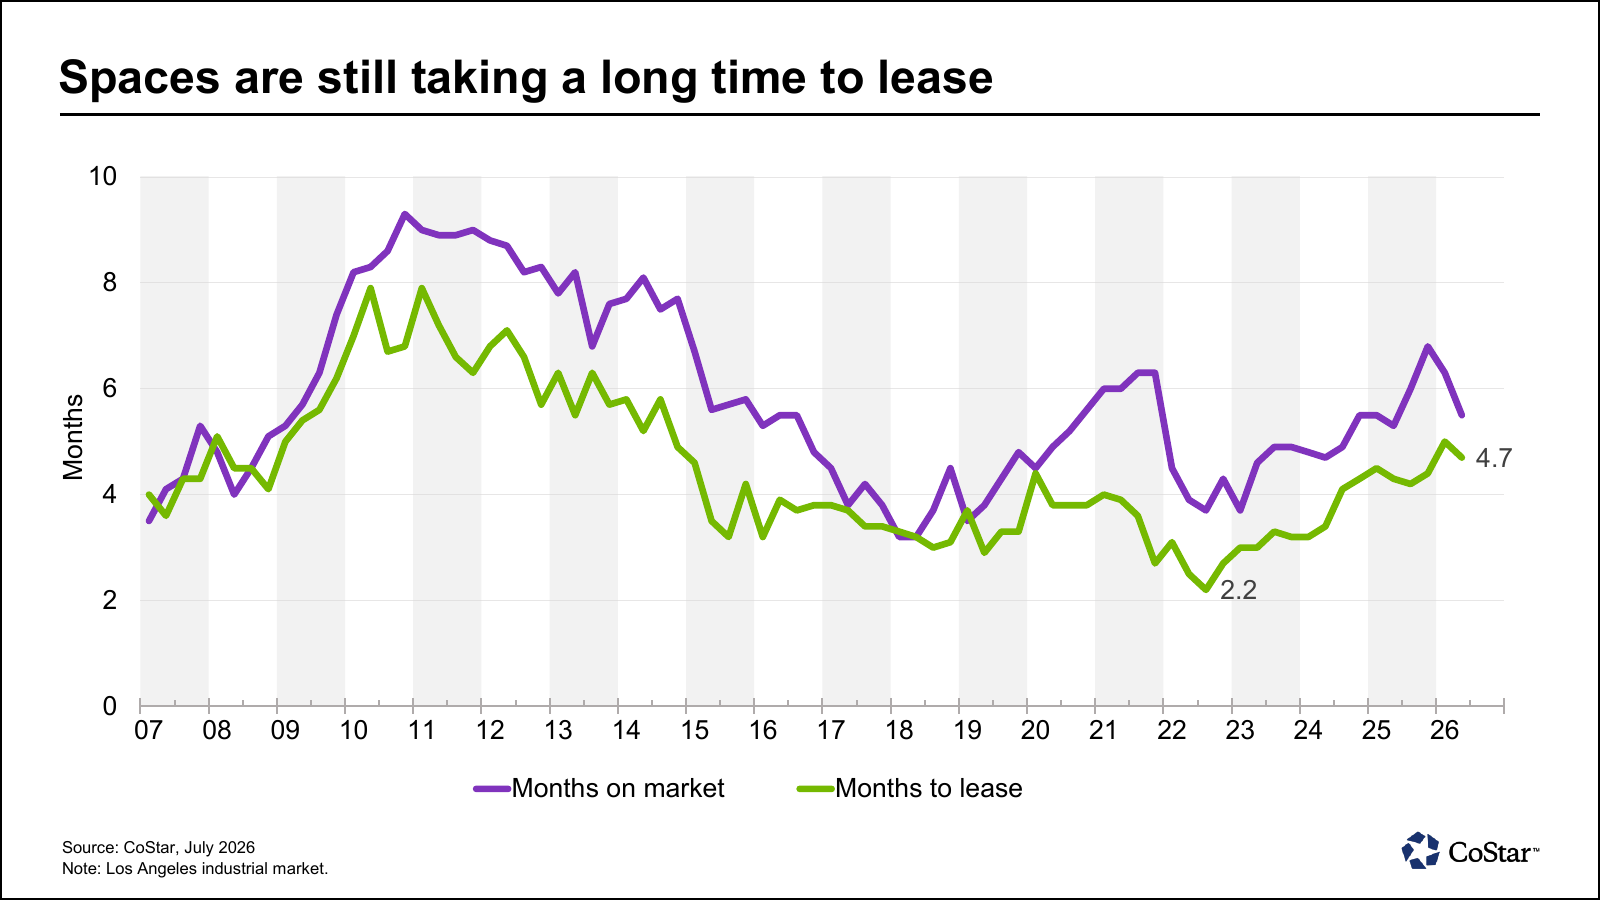
The average Los Angeles property takes about 4.7 months to lease in this measure. A tenant's calendar also includes negotiations, permits, improvements, and the move itself. Check the notice deadlines in your current lease first.
From the desk
Before you respond to a renewal proposal, find out what a move would cost and which buildings could accommodate your business. If buying is a serious possibility, bring that into the discussion while there is still time to evaluate a property.
For landlords, it helps to know what a tenant would need to spend to make a competing building work. A lower asking rent can lose its appeal once the required improvements and move are priced in.
Have a lease decision coming up or a purchase in mind? Reply with the area and approximate square footage you need, along with your timing.
Senior Vice President and Principal
Lee & Associates | Irvine
jbsmith@leeirvine.com | 949.400.4786
Sources
Charts are from CoStar's Q2 2026 State of the Market presentations for Los Angeles industrial, Orange County industrial, and Inland Empire office and industrial. Chart source dates range from April through August 2026. The OC building-size charts are dated April, and the LA construction chart is dated August. New-leasing figures exclude renewals. Asking rents are monthly NNN per square foot. Executed and effective rents may differ. Availability and vacancy are separate measures. Commentary by Justin Smith.