Industrial Insights Newsletter
Industrial Insights — Q2 2026 Early Look at the Numbers
Six markets in, and the primary reports beat the headlines. An early read on Phoenix, Las Vegas, Orange County, San Diego, Seattle and the Inland Empire, each against the other five.
Q2 closed June 30, and the market reports arrive the way they always do, a few at a time over several weeks rather than all at once. Six markets are in. Rather than wait for the full national picture to resolve, this is an early read on what the primary reports actually show, the real figures behind the headlines, not a recap of a recap.
Every market here gets read against the other five, and that is not incidental. A distribution tenant renewing in Orange County this quarter might open a second site in Phoenix next year and evaluate Dallas the year after. Reading these markets side by side is what lets me tell a client whether a number they are hearing about their own building is unusual, or just part of a pattern playing out across the country.
The scorecard
Six markets in, and the primary numbers beat the headlines
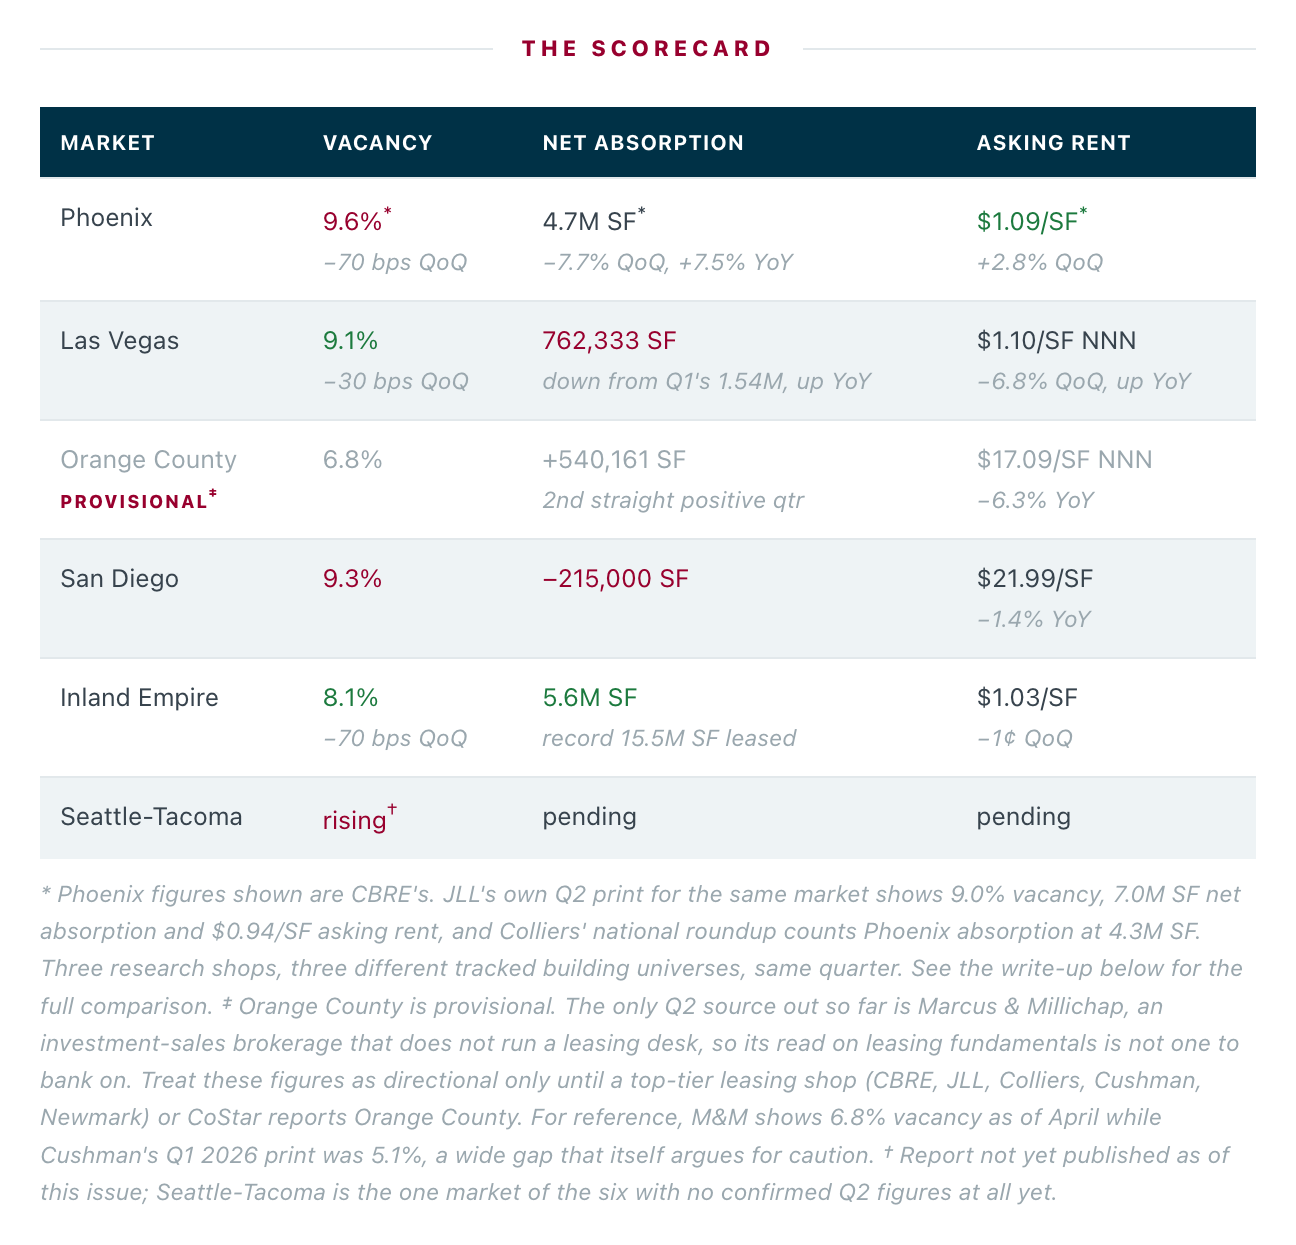
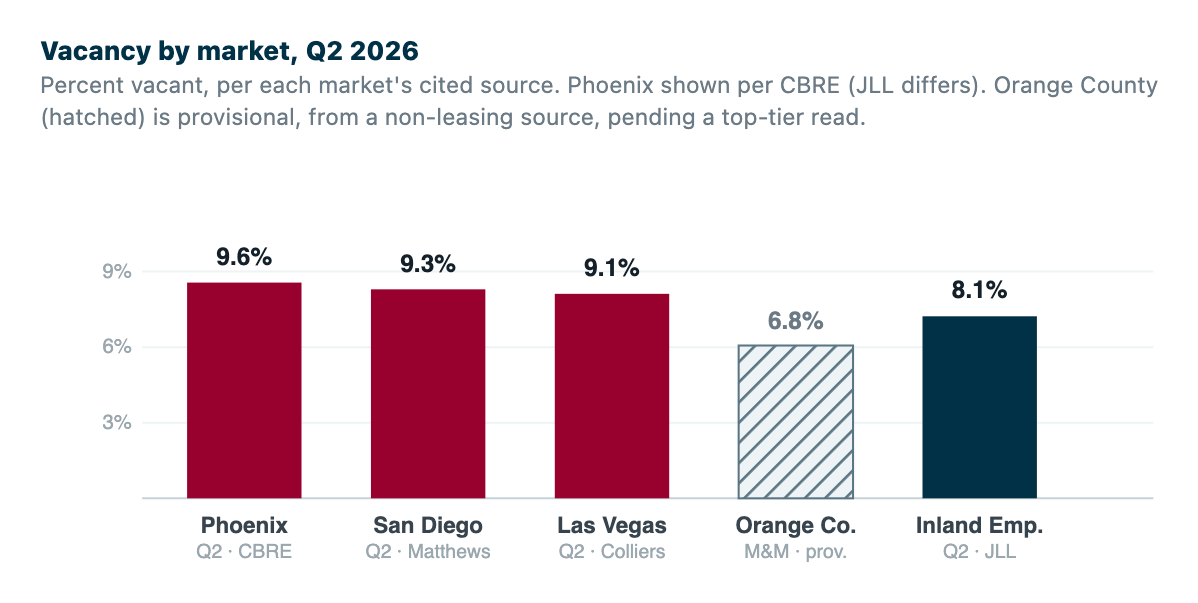
Here is where each market sits today, which is why this is an early read rather than the last word. The full six-market picture first, then market by market below.
Market by market
Read each against the other five
Phoenix, tightening, and AI is now a real demand driver
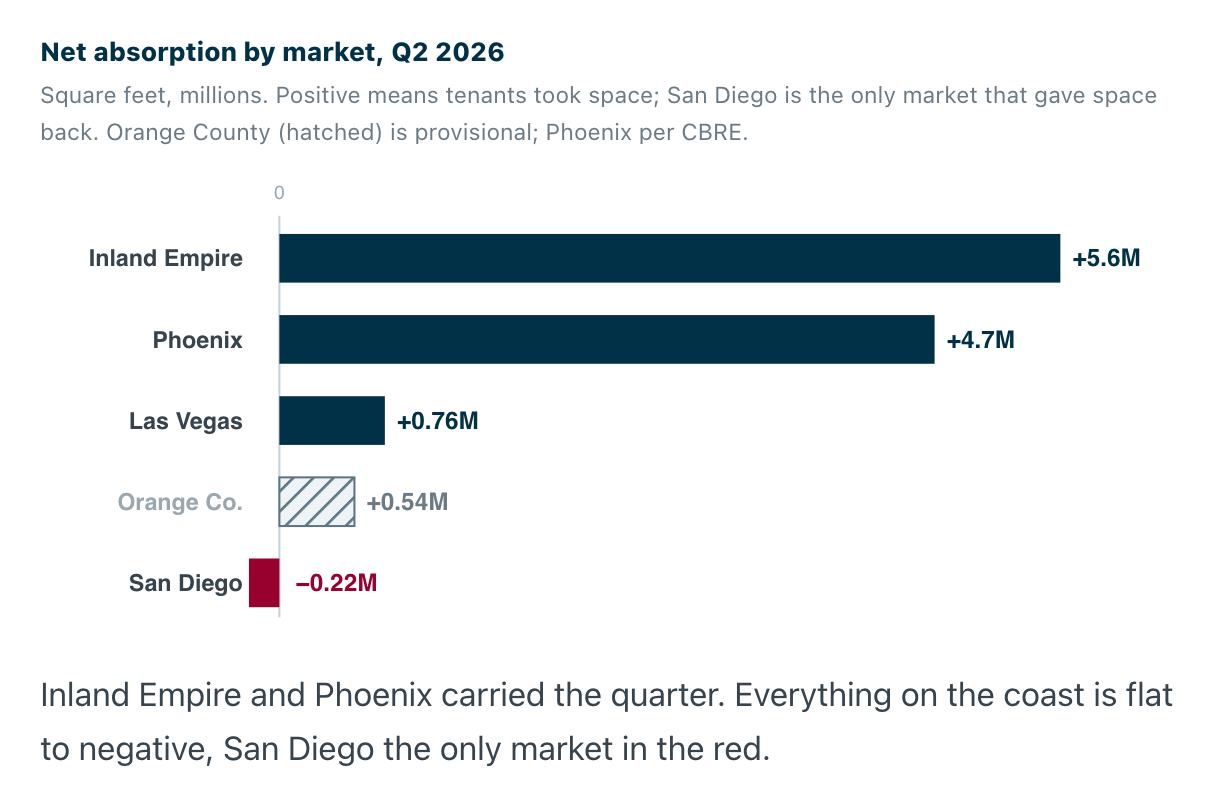
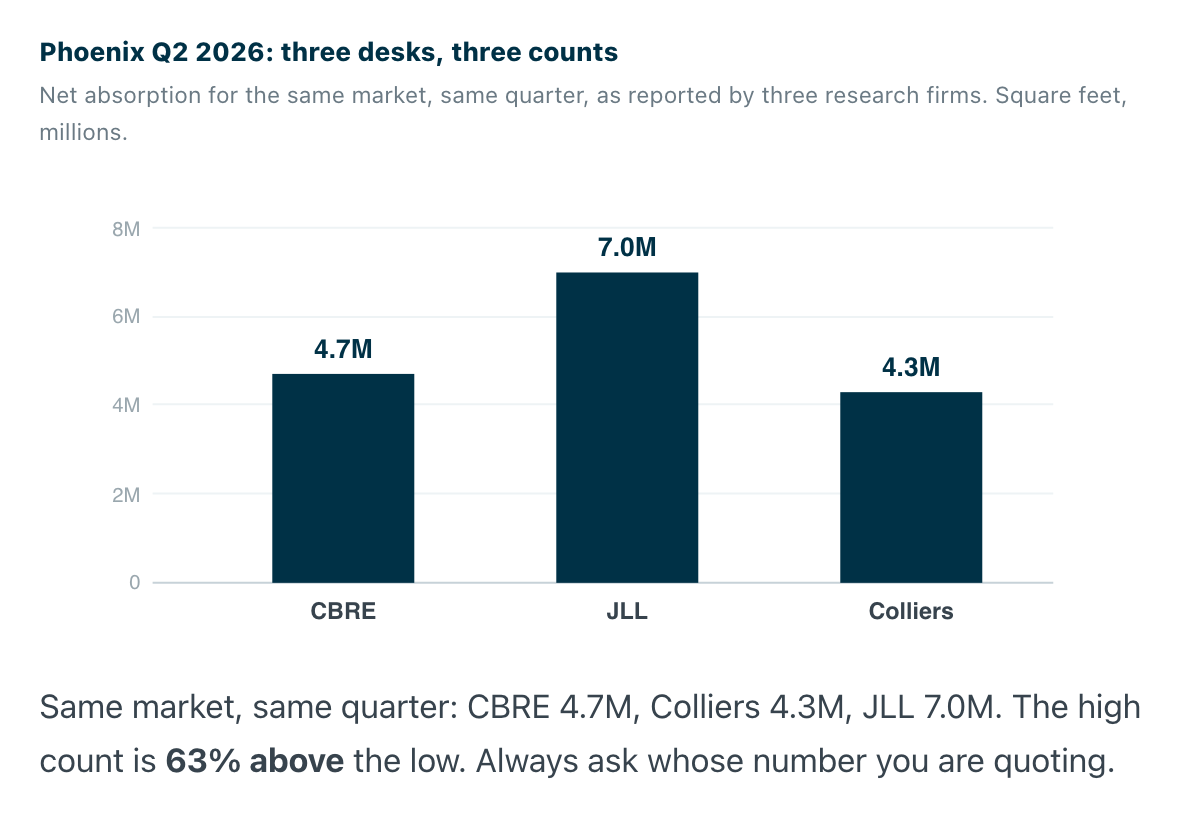
CBRE: 9.6% vacancy (−70 bps QoQ), 4.7M SF absorbed, $1.09/SF asking. JLL: 9.0% vacancy, 7.0M SF absorbed, $0.94/SF asking.
Pull the primary reports and Phoenix looks even stronger than the last issue had it, though the two research shops do not agree on the size of the quarter. Both agree on direction and both agree construction is rebuilding after two years of contraction. The new element worth flagging: an AI-focused occupier leased roughly 1.15M SF at Luke Field, and Fluidstack signed two Southwest Valley leases totaling 1.15M SF, alongside a 1.2M SF DHL commitment. Large-block availability is approaching near-zero per JLL, which is the real story behind the vacancy compression. The West Valley is by far where the big box DC deals are absorbing.
Las Vegas, cooling from a hot Q1, still healthy
9.1% vacancy (−30 bps QoQ), 762,333 SF absorbed, $1.10/SF NNN asking, 3.9M SF under construction.
Vegas is still climbing out of the warehouse supply surge of the past two years, but Q2 came in softer than Q1: absorption of 762,333 SF was down from 1.54M SF the prior quarter, though still well above the 544,400 SF a year ago. The weighted asking rate eased to $1.10 from $1.18 in Q1, still above $1.03 a year ago. Deliveries were unusually light and the construction pipeline continues shrinking, 3.9M SF against 7.45M a year ago. Easing rents but a shrinking pipeline points to the market working off its overbuild rather than sliding into a deeper correction.
Orange County, provisional read only, hold it loosely
The only Q2 numbers out for Orange County so far are from an investment-sales shop with no leasing desk, so everything here is provisional until a leasing-focused source prints the report.
Provisional: 6.8% vacancy, +540,161 SF absorbed, $17.09/SF NNN (−6.3% YoY). For directional context only, their read is a market still correcting from the top but not evenly, with distribution and big-box vacancy roughly doubling toward 14% while warehouse and small-bay held tighter, under 6%. If a leasing source confirms that split, it is the familiar lesson that building size matters more than the market average here.
San Diego, still normalizing
9.3% vacancy, −215,000 SF absorbed, $21.99/SF asking (−1.4% YoY).
Negative absorption for the quarter, with tenant caution and slower leasing continuing to define the market. Landlords are pricing down and adding concessions to stay competitive. The report frames this as normalization after several strong years rather than a structural problem, but it is the softest of the six reporting markets by net absorption. We are running a few larger manufacturing assignments here and finding the market slow, with landlords aggressively courting the handful of credit tenants that are active.
Seattle-Tacoma, the outlier, still marking down
Vacancy still rising; hard Q2 figures not yet public.
The one market of the six where the story has not turned. Vacancy continues climbing as tenants relinquish space for newer post-2000 construction. The 50,000 to 200,000 SF segment weakened further on tenant consolidations. The drag traces back to trade: container throughput at the Northwest Seaport Alliance has trailed year-ago levels through the first half of 2026 on falling imports. Aerospace and clean-energy manufacturing demand is the one thing analysts point to as a possible offset later this year.
Inland Empire, the correction corrected: this was the standout quarter
8.1% vacancy (−70 bps QoQ), 5.6M SF net absorption, 15.5M SF leased (a market record), $1.03/SF asking.
Last issue I had this market marked pending. Wrong call, and worth correcting properly. JLL's full report shows Q2 was the strongest quarter for new leasing in Inland Empire in recent history, 15.5M SF signed, with June alone accounting for 7.5M SF. Net absorption was 5.6M SF, a sharp reversal from a negative Q1. The more durable signal: for the first time in four years, year-to-date net absorption outpaced construction deliveries. Under construction sits at 13.1M SF, well below the historical quarterly average of 21.8M, so that supply discipline should keep compressing vacancy through year end. IE West is at $1.15 and IE East softer at $0.93, a spread worth knowing before you quote a blended number.
The national picture
Demand is outrunning supply, decisively
A year ago the U.S. delivered 75M SF against just 28M SF of demand. This quarter demand reached 59M SF, its highest in years, while new supply fell to 53M SF, the lowest since 2016. That is the tailwind under every market above.
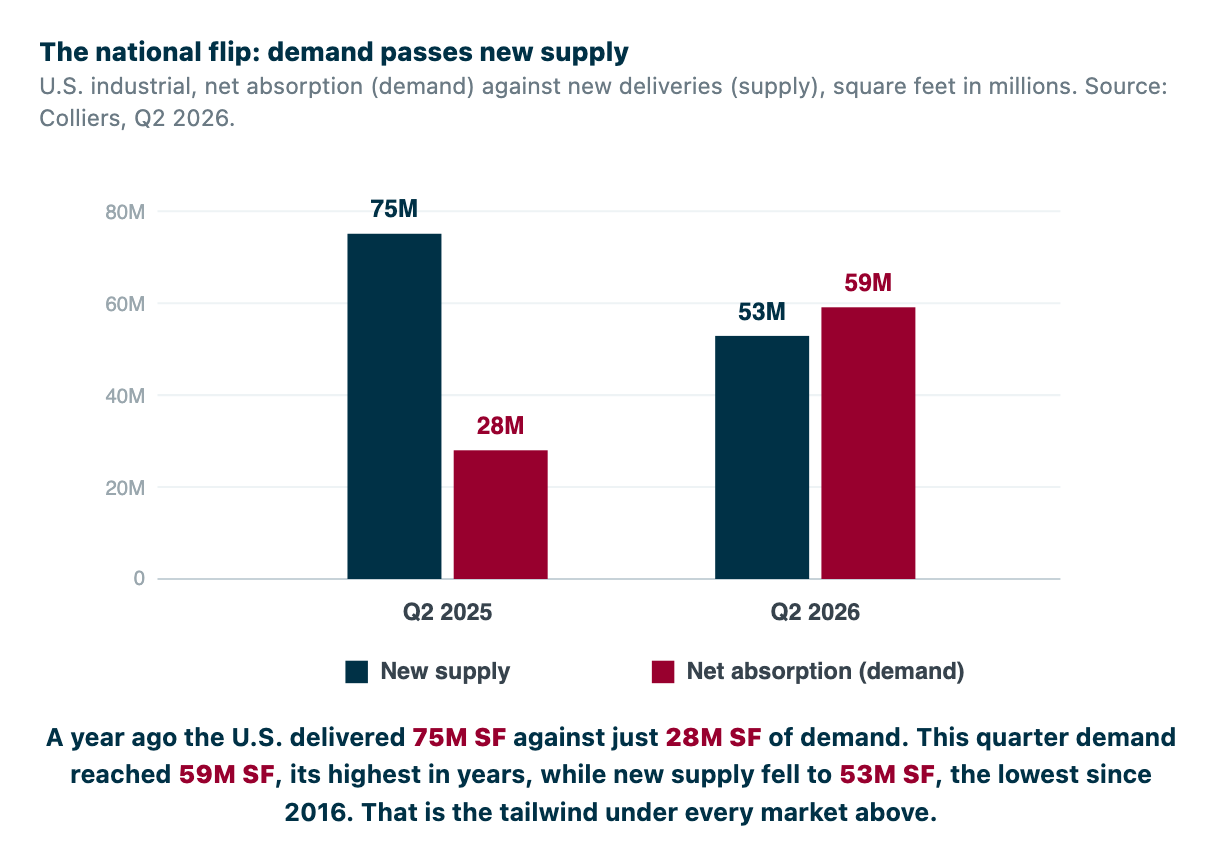
Colliers' national roll-up confirms the pattern: net absorption hit 59M SF, more than double the 27M a year ago and up 17% from Q1, while new supply fell to 53M. U.S. vacancy is 7.3%, essentially flat after rising for two-plus years, and vacancy declined or held in 63% of the 79 markets Colliers tracks. The biggest declines were Indianapolis, Charleston, Columbus and Phoenix. The West is the one region where the construction pipeline shrank year over year, which lines up with what Phoenix and Las Vegas are both showing after two years of pulling back on new starts.
Still on Q1, mostly
What has not reported yet
Dallas-Fort Worth, Salt Lake City, Northern California and Boise have not published standalone Q2 reports yet; typical lag is four to eight weeks past quarter end. Two have real Q2 data already hiding in the national numbers: Los Angeles at 4.4M SF of Q2 net absorption, and Dallas-Fort Worth at 4.7M SF, the second highest of any U.S. market behind Houston, with the single largest construction pipeline in the country at 36.3M SF. I have a weekly sweep running and will send the next roundup as the rest clear.
From the desk
What market is your next project in? Send it over and I will run it against the primary reports and the current comp set, and tell you whether the number you are hearing about your own building is unusual or just part of the pattern.
Senior Vice President and Principal
Smith Industrial Partners
Lee & Associates — Irvine
9838 Research Dr., Irvine, CA 92618
jbsmith@leeirvine.com
Sources
CoStar US industrial market data. JLL US Industrial Market Dynamics Q2 2026. CBRE, Colliers, Cushman & Wakefield and Marcus & Millichap Q2 2026 market reports. Figures are each market's cited source and are identified where they differ.