Industrial Insights Newsletter
Industrial Insights — September 2025 (2nd Edition)
Budget season is here. A national read on why leasing is strong, the record 1.7 billion SF renewal wave coming for 2026 to 2028, and where the leverage sits.
All operators have some form of budget initiative right now. Every budget process is unique, and nearly all include a real estate analysis: forecasting lease commitments for 2026 and 2027 to prepare for relocation costs and fair-market rent adjustments, and to get out ahead of the timelines, because every project that involves real estate also involves equipment, automation, setup and construction schedules with variable cost and time.
At NAIOP's last function I reviewed James Breeze's State of the US Industrial and Logistics Market report for September, which is worth your attention. Since our Southern California book has grown into a nationwide practice and most of our clients are multi-market, the national read is more timely than ever.
National market trends
Leasing is strong even as absorption stays thin
In June 2025, U.S. industrial leasing reached 60 million SF, 24% higher than June 2024 and 19% above the previous record set in 2022. For the first half of 2025, leasing totaled 424 million SF, an 8.5% increase over mid-year 2024.
Why leasing is strong
- Flight to quality: occupiers are taking concessions in newer buildings and moving out of older facilities. Q2 was still the weakest positive absorption quarter since 2010, which underscores the shift.
- Early renewals: roughly 34% of 2025 leasing has come from tenants locking in space ahead of schedule.
- 3PL outsourcing: with availability rising faster than vacancy, many retailers and wholesalers are outsourcing to third-party logistics providers, often vacating their own facilities as leases expire.
3PL and manufacturing lead the volume
- 3PL bulk space (over 100,000 SF) finished mid-year at 91.6 million SF, up 8.0% on robust demand for leases under 700,000 SF.
- 3PLs were the top occupier by far, a 34% market share and a 25% increase in leasing from a year ago.
- Manufacturing, only 10.8% of national demand, is still up 51% from last year.
Supply and demand
Deliveries at a multi-year low, absorption barely positive
First-half 2025 construction completions totaled 132.6 million SF, the lowest first-half delivery since 2017, while net absorption barely stayed positive at 3.5 million SF in Q2, the weakest since 2010, pushing vacancy to 6.6%, its highest since 2014. Net absorption is skewed heavily toward new construction, roughly half of it in properties built from 2023 to 2025. Construction starts have now declined for 11 consecutive quarters, though the rate of decline has slowed significantly.
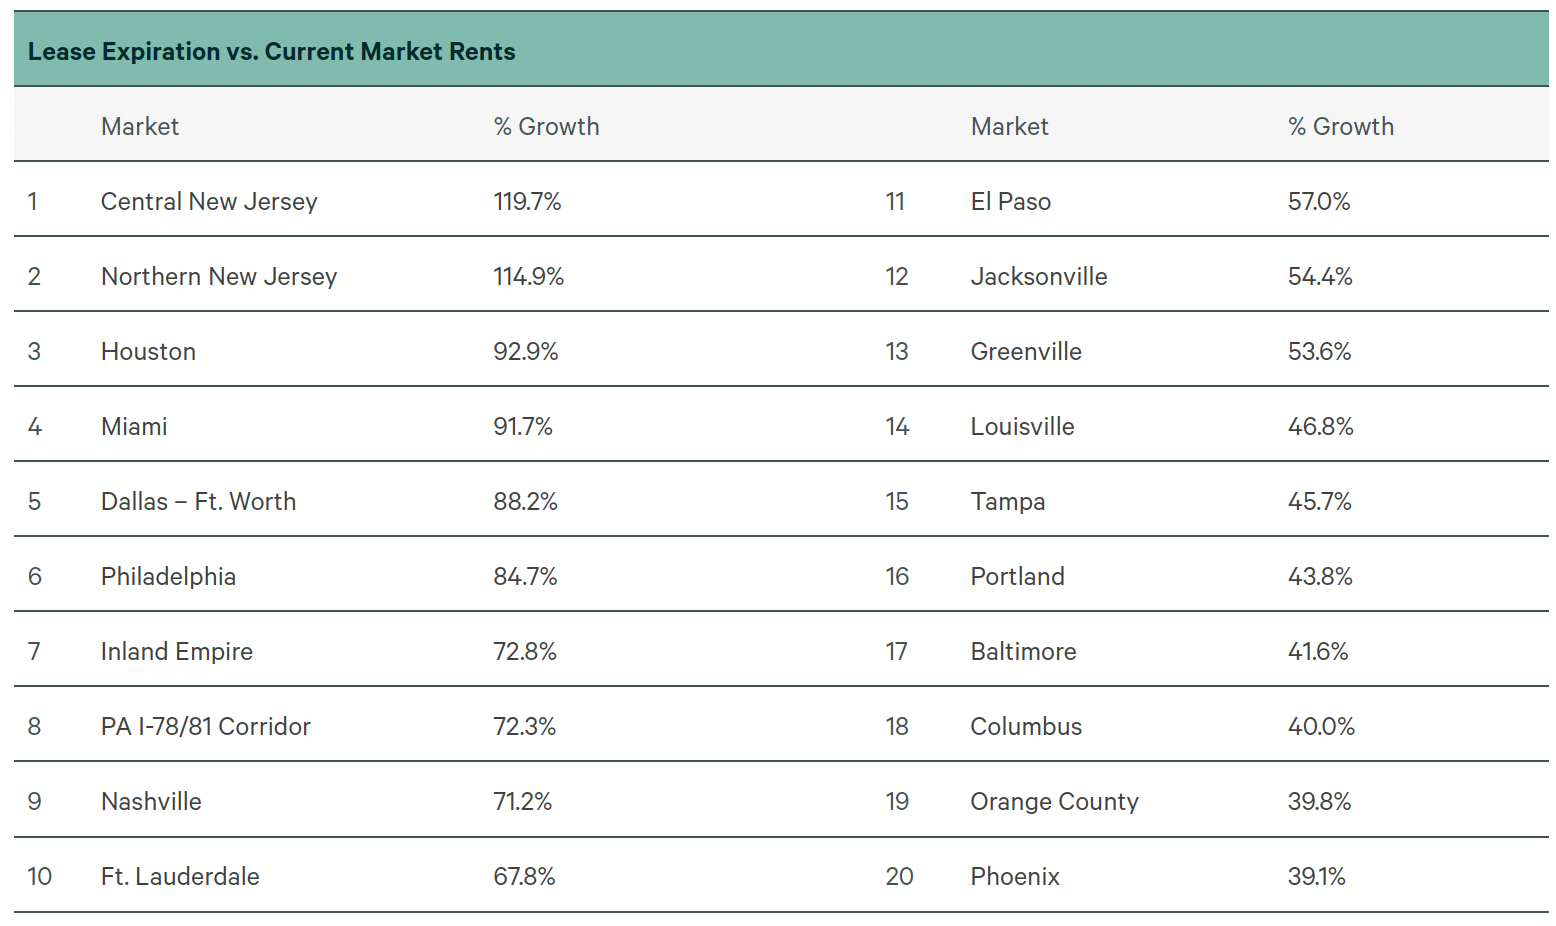
Lease expiration vs current market rents
What renewals will cost when the peak leases roll
On average, tenants facing 2025 lease expirations will see rents about 30% higher, with Northern and Central New Jersey up more than 2x, though the gap should narrow as more post-Covid leases reach their five-year mark.
Landlord vs tenant markets
Four categories, and Southern California leans tenant
Dividing the U.S. into four categories by demand strength, supply balance and rent trend, conditions vary widely. Some markets are still clearly landlord-driven; others now tilt toward tenants.
Landlord-favorable (all three fundamentals strong)
- Chicago, Houston, Kansas City, Louisville, Sacramento, Minneapolis, Northern Virginia.
Lean landlord-favorable (two of three)
- Charlotte, Cleveland, Detroit, Silicon Valley, South Florida, Pittsburgh, Columbus, Greensboro.
Lean tenant-favorable (one favorable factor)
- Inland Empire, Los Angeles, Dallas-Fort Worth, Orange County, Northern NJ, Boston, Portland, San Diego, Atlanta.
Tenant-favorable (supply outpacing demand, rents softening)
- Austin, Phoenix, Seattle, Las Vegas, Reno, Philadelphia.
The record renewal wave
1.7 billion SF rolls between 2026 and 2028
From 2026 to 2028, nearly 1.7 billion SF of industrial space comes up for renewal nationwide, the largest wave of expirations on record. Expect tenants to reassess footprints and many to consolidate into newer facilities, which could drive significant negative absorption in older buildings as space is shed. The top five renewal markets mirror the five largest markets in the country.
| # | Market | Expiring SF |
|---|---|---|
| 1 | Inland Empire | 157.3M SF (24% of inventory) |
| 2 | Chicago | 135.1M SF |
| 3 | Dallas-Fort Worth | 112.6M SF |
| 4 | Los Angeles | 97.4M SF |
| 5 | Northern-Central New Jersey | 83.2M SF |
Podcast
Port of Long Beach COO, Dr. Noel Hacegaba

One of the most important conversations we have had on Industrial Insights, on how the nation's busiest gateway is investing in rail, streamlining truck appointments, and shaping the future of supply chains. Three takeaways for tenants:
Three key insights for tenants
- Where the cargo really goes: only about a third of containers stay in Southern California; the other two-thirds move inland, primarily to Chicago, Dallas, Memphis and Kansas City. Port throughput is not warehouse demand.
- Rail is the future: today only about 25% of cargo moves ship-to-train. The Pier B on-dock rail facility ("Project Beast"), a $1B+ investment with more than $300M in federal funding, will nearly double that to 4.7M TEUs a year.
- Truck pickup streamlining: a universal appointment system is rolling out across the Long Beach and Los Angeles complex, meaning fewer missed appointments and better velocity from port to warehouse.
Listen on YouTube or Apple Podcasts.
The reports
Two Southern California tools for this budget cycle
Our Hundreds Report tracks the 100,000 to 200,000 SF segment across Southern California: Los Angeles vacancy in the mid-4s with concessions and tenant improvements now standard, Orange County near 4.4% with rising sublease and easing asking rents, and the Inland Empire stabilized in the high 7s to low 8s with landlords sharpening pricing.
Our Owner/User Report helps companies evaluate whether buying beats renewing or leasing. With rents off peak and user demand driving sales at attractive cap rates, the buy-versus-lease math is worth a fresh look.
From the desk
If your team is planning operational changes or facing a lease event in the next 12 to 36 months, now is the time to start the conversation. Reach out and let's design a strategy that aligns your supply chain with your footprint.
Senior Vice President and Principal
Smith Industrial Partners
Lee & Associates — Irvine
9838 Research Dr., Irvine, CA 92618
jbsmith@leeirvine.com
Sources
CBRE, State of the US Industrial and Logistics Market, September 2025 (James Breeze). Smith Industrial Partners Hundreds Report and Owner/User Report, Southern California, 2025. Industrial Insights podcast, Port of Long Beach.