Industrial Insights Newsletter
Industrial Insights — The Market Health Lie Detector
The net absorption to gross leasing ratio: the one number that tells you whether a market is actually growing, and who holds the leverage.
When the big industrial REITs report record leasing, they leave out the one metric that tells you whether a market is actually growing, and who has the leverage. That is net absorption divided by leasing demand. I have taken it and run it across every U.S. industrial market above 200 million SF, then broken it down to compare our Southern California markets with Phoenix and Dallas, where many SoCal businesses also operate, and waded into the SoCal submarkets with a fine tooth comb. Lots of great takeaways in this week's letter.
01 · National
There's a difference between active and growing
Every quarter a landlord quotes you a leasing number. Millions of feet signed, proof the market is hot. It's the wrong number. Think of leasing as revenue and net absorption as profit. A landlord talking about record leasing volume is still good news, but it doesn't tell you what the market is actually doing.
Divide one by the other and you get conversion, a market's batting average (for you baseball fans). A hitter can take a thousand at-bats and go hitless. A market can lease a meaningful 60 million SF and still not post a proportionate gain in net absorption.
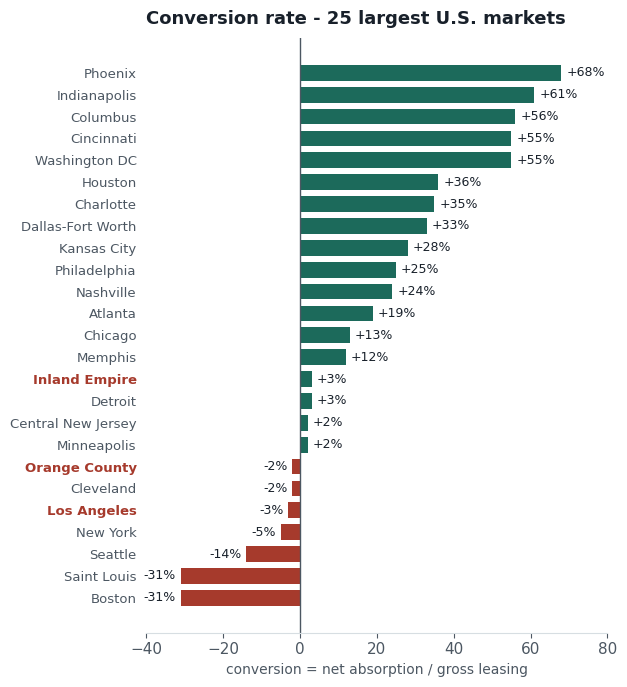
The standout market here is Phoenix. We're working on a larger distribution center assignment there right now, and finding this true on the ground. Phoenix is a historically boom and bust market that has quadrupled its supply of Class A industrial in the West Valley, and corporates keep reorienting their Southern California supply chains toward it.
The Inland Empire leased 68.5 million SF last year and kept 3% of it. Nine of every ten feet signed simply backfilled space someone else had walked away from.
In the REITs' own words · Q2 2026
Two big industrial REITs reported within weeks of each other, both leaning on their leasing headlines. Prologis, national, leased a record 67 million SF at 95.5% occupancy and still marked rents up 36% on rollover; it even flagged U.S. net absorption at 66 million SF, the best since 2022. Rexford, a Southern California pure-play, also posted heavy leasing (2.1 million SF, 95% occupied), yet signed its new leases 13.8% below the prior rent, with comparable rents down 2.8% (down 11.3% on a cash basis). Same headline; opposite rent reality.
02 · Regional
Southern California is correcting. America isn't.
If you index every market's asking rent to 2019 and chart from there, you see almost all of them climb through the pandemic and keep climbing. Two break the pattern: Los Angeles and the Inland Empire. CoStar's own forecast doesn't return LA to its old peak until 2031.
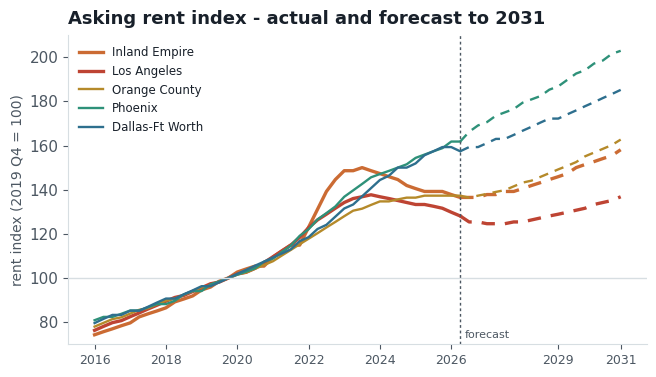
It isn't supply. LA is building 0.3% of its stock and Orange County 0.1%, among the lowest pipelines in the country. Vacancy roughly doubled, but off a 2% to 4% base, the tightest in the nation. What reversed was demand. The San Pedro Bay ports handle a third of the nation's containerized imports; the 2021 to 2022 import surge that ran through them unwound, and the Inland Empire is the ports' back lot.
| Market | Rent | vs 2019 | Off peak | Back to peak |
|---|---|---|---|---|
| Los Angeles | $1.46 | +28% | −7% | 2031 |
| Inland Empire | $1.01 | +37% | −8% | 2029 |
| Orange County | $1.62 | +37% | −0.3% | at peak |
And it's all of Southern California, in stages: LA and the Inland Empire first, Orange County and San Diego right behind. OC's rent is still at its high, but vacancy doubled underneath it.
03 · Local
The correction is a big-box event
Here we broke each SoCal market's stock into five size buckets to show how rents moved by building size.
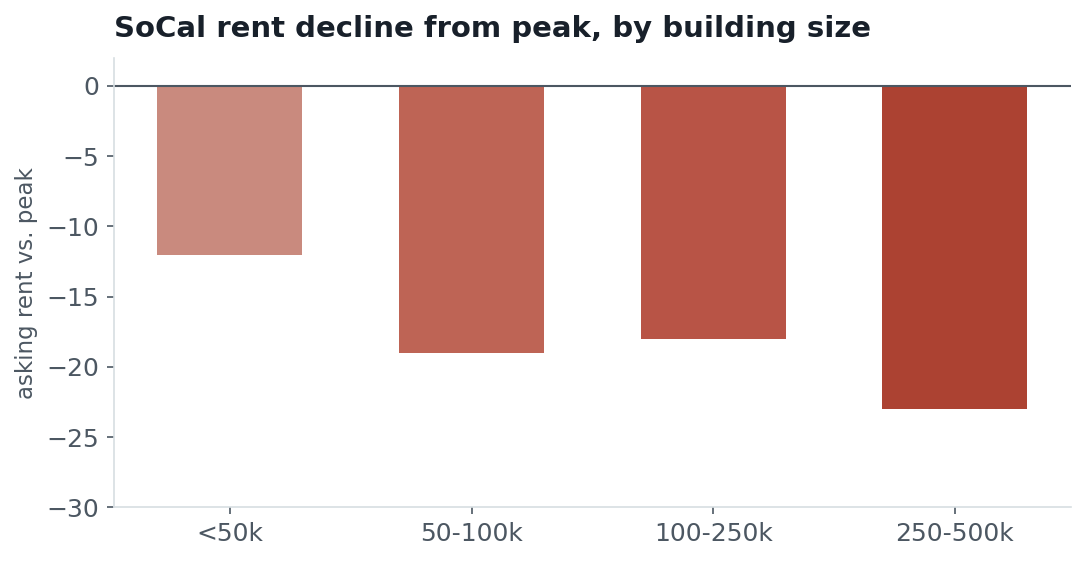
Small-bay largely held steady where the big boxes fell the most. Small-bay is the contact hitter: thousands of small tenants, no new supply, singles all day, almost never a slump. Big-box is the power hitter. It's the product SoCal actually built into the boom, and one 700,000-foot tenant moves the whole cohort. When the swings connect, rents soar. When they miss, the strikeouts are brutal. Veteran commercial real estate professionals will recognize the pattern from Class A office in past cycles.
It's a class-A story. Both markets ran their newest big-box product to the top of the range at the peak, LA's premium space pushing past $2.50 a foot and the Inland Empire's nearly $2. Since then the IE has given the most back in dollars, new class-A settling near $1, while LA has eased off its high but still holds the region's premium rents.
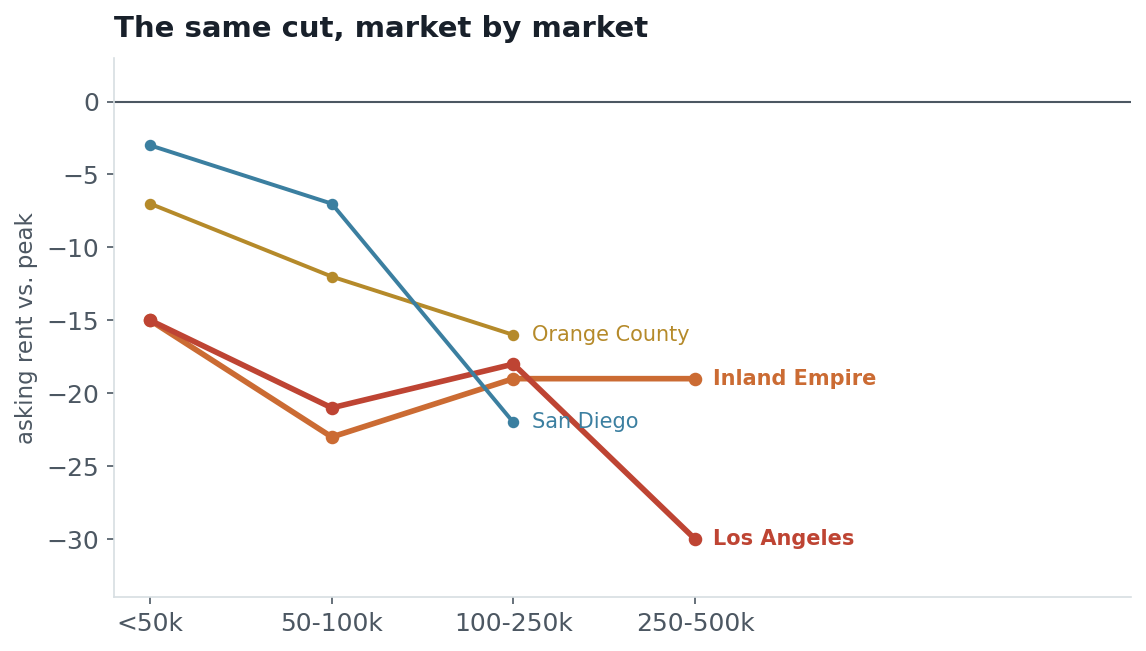
Orange County and San Diego barely register here. They never had the boxes. Coastal SoCal built small; the mega-box repricing is an LA and Inland Empire event. The size cohort is the risk.
04 · The map
The softness has an address
Zoom in and the correction has a geography. Map all eighty Southern California industrial submarkets by availability and the soft ones cluster in one place, the Inland Empire's big logistics submarkets. The Airport Area around Ontario, the single largest industrial submarket in the region at 259 million SF, sits at 12% available. Moreno Valley, San Bernardino, Riverside, the high desert: all above the regional average. LA's infill core and Santa Ana barely moved.
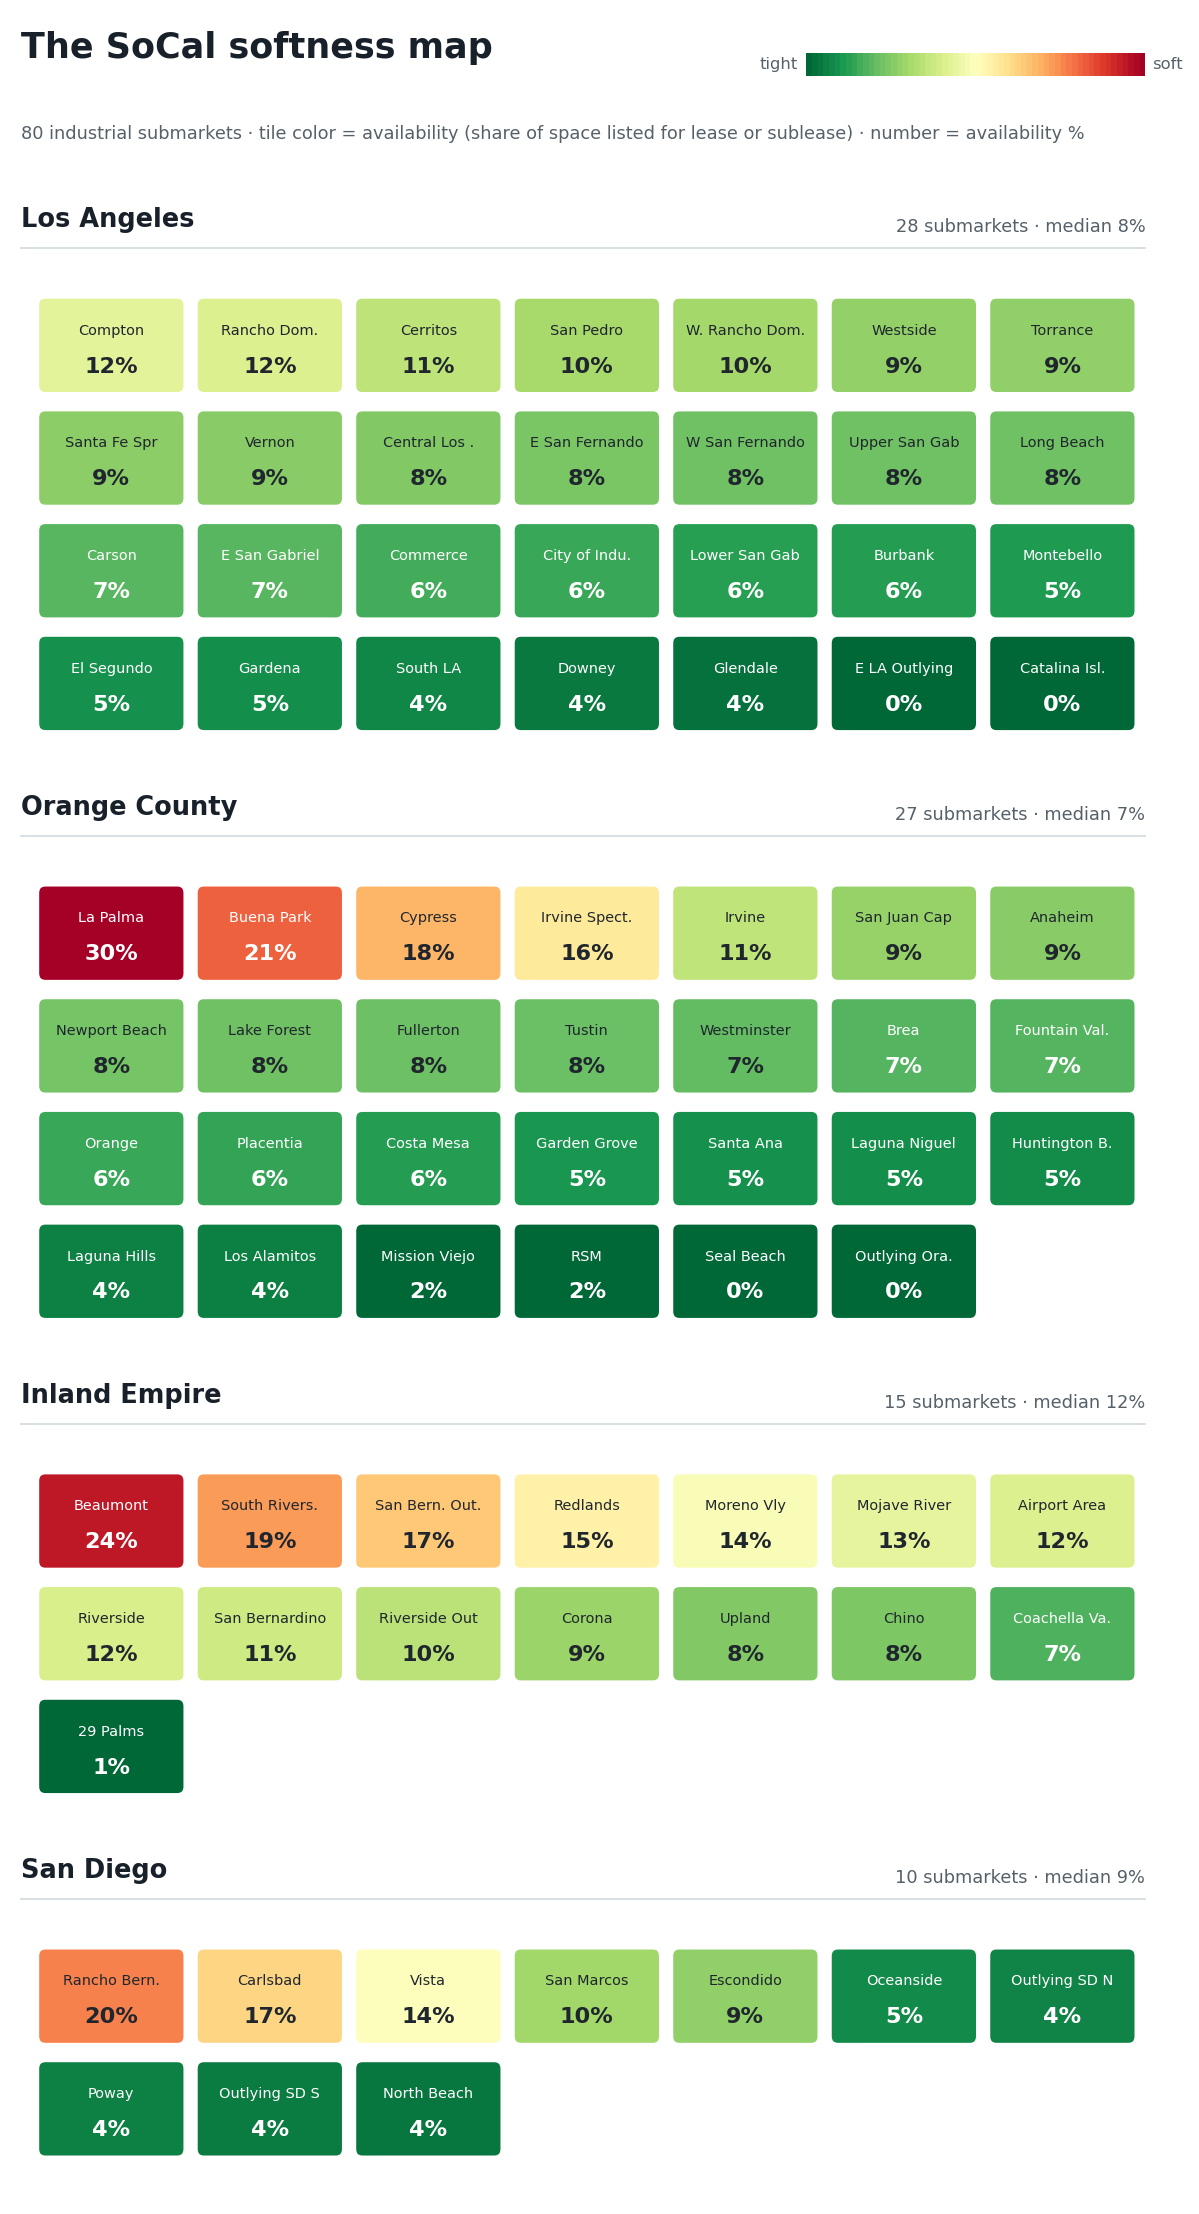
The notable submarkets by market, trailing 12 months, sorted by net absorption. Inventory, net absorption and deliveries in millions of SF. Source: CoStar, Q2 2026.
| Submarket | Inv | Avail | Rent | Net Abs | Deliv |
|---|---|---|---|---|---|
| Moreno Valley/Perris | 112.6 | 13.6% | $0.84 | +3.73 | 2.65 |
| San Bernardino | 106.7 | 11.3% | $0.89 | +3.63 | 1.22 |
| Redlands/Loma Linda | 33.9 | 15.0% | $0.89 | +0.84 | 0.87 |
| South Riverside | 24.6 | 19.0% | $1.25 | +0.19 | 0.15 |
| Chino/Chino Hills | 57.5 | 8.2% | $1.05 | +0.01 | 0.04 |
| Corona/Eastvale | 39.7 | 9.2% | $1.21 | −0.09 | 0.00 |
| Mojave River Valley | 32.1 | 12.6% | $0.92 | −0.33 | 0.67 |
| Riverside | 83.0 | 11.8% | $1.03 | −1.38 | 0.09 |
| Airport Area | 258.8 | 12.0% | $1.04 | −1.69 | 3.97 |
| Submarket | Inv | Avail | Rent | Net Abs | Deliv |
|---|---|---|---|---|---|
| Commerce | 50.8 | 6.4% | $1.22 | +1.06 | 0.13 |
| City of Industry | 90.3 | 6.1% | $1.30 | +1.03 | 0.62 |
| Santa Fe Springs/La Mirada | 71.6 | 8.7% | $1.30 | +0.45 | 0.49 |
| Lower San Gabriel Valley | 30.7 | 5.6% | $1.38 | +0.10 | 0.00 |
| Carson | 39.6 | 7.0% | $1.41 | −0.31 | 0.36 |
| Central Los Angeles | 68.6 | 8.4% | $1.66 | −0.43 | 0.02 |
| Upper San Gabriel Valley | 43.9 | 7.8% | $1.48 | −0.53 | 0.11 |
| West San Fernando Valley | 48.9 | 7.8% | $1.69 | −0.56 | 0.16 |
| Vernon | 83.6 | 8.6% | $1.20 | −0.71 | 0.20 |
| Torrance | 36.1 | 8.9% | $1.54 | −0.74 | 0.11 |
| East San Fernando Valley | 55.0 | 8.1% | $1.58 | −1.16 | 0.02 |
| Submarket | Inv | Avail | Rent | Net Abs | Deliv |
|---|---|---|---|---|---|
| Santa Ana | 35.9 | 4.9% | $1.59 | +0.70 | 0.21 |
| Buena Park | 14.2 | 21.0% | $1.35 | +0.34 | 0.00 |
| Irvine | 18.1 | 10.7% | $1.79 | +0.11 | 0.05 |
| Orange | 16.0 | 6.1% | $1.55 | +0.04 | 0.29 |
| Costa Mesa | 12.5 | 5.5% | $1.96 | −0.03 | 0.00 |
| Anaheim | 51.0 | 8.6% | $1.52 | −0.05 | 0.60 |
| Huntington Beach | 17.2 | 4.7% | $1.55 | −0.06 | 0.00 |
| Garden Grove | 14.3 | 5.2% | $1.48 | −0.07 | 0.00 |
| Brea/La Habra | 17.7 | 6.9% | $1.47 | −0.12 | 0.00 |
| Fullerton | 21.1 | 7.7% | $1.41 | −0.29 | 0.00 |
| Irvine Spectrum | 21.8 | 15.5% | $1.85 | −0.46 | 0.93 |
| Submarket | Inv | Avail | Rent | Net Abs | Deliv |
|---|---|---|---|---|---|
| Escondido | 8.6 | 8.9% | $1.58 | +0.03 | 0.00 |
| Poway | 9.9 | 4.2% | $1.70 | −0.01 | 0.00 |
| Oceanside | 10.3 | 4.6% | $1.40 | −0.06 | 0.00 |
| San Marcos | 9.3 | 9.5% | $1.49 | −0.13 | 0.00 |
| Vista | 15.0 | 13.9% | $1.41 | −0.19 | 0.13 |
| Rancho Bernardo | 7.5 | 19.9% | $1.94 | −0.25 | 0.00 |
| Carlsbad | 16.4 | 16.6% | $1.82 | −0.37 | 0.06 |
Sublease is the early-warning line. Region-wide it's a manageable slice of what's available, but it pools where tenants are quietly shedding space. Torrance, the Mojave, Moreno Valley and City of Industry each carry a quarter to a third of their availability as sublease.
05 · Value
Rents are the input, value is the output
Everything to here has been about rent, what a building earns. Value is what it's worth. Plot the two together, how much demand a market actually converts against where its property values sit versus peak, and the divide reappears in dollars. The markets that turn leasing into occupancy are trading at their value highs: Phoenix, Dallas, Atlanta, all at peak. Southern California has given value back.
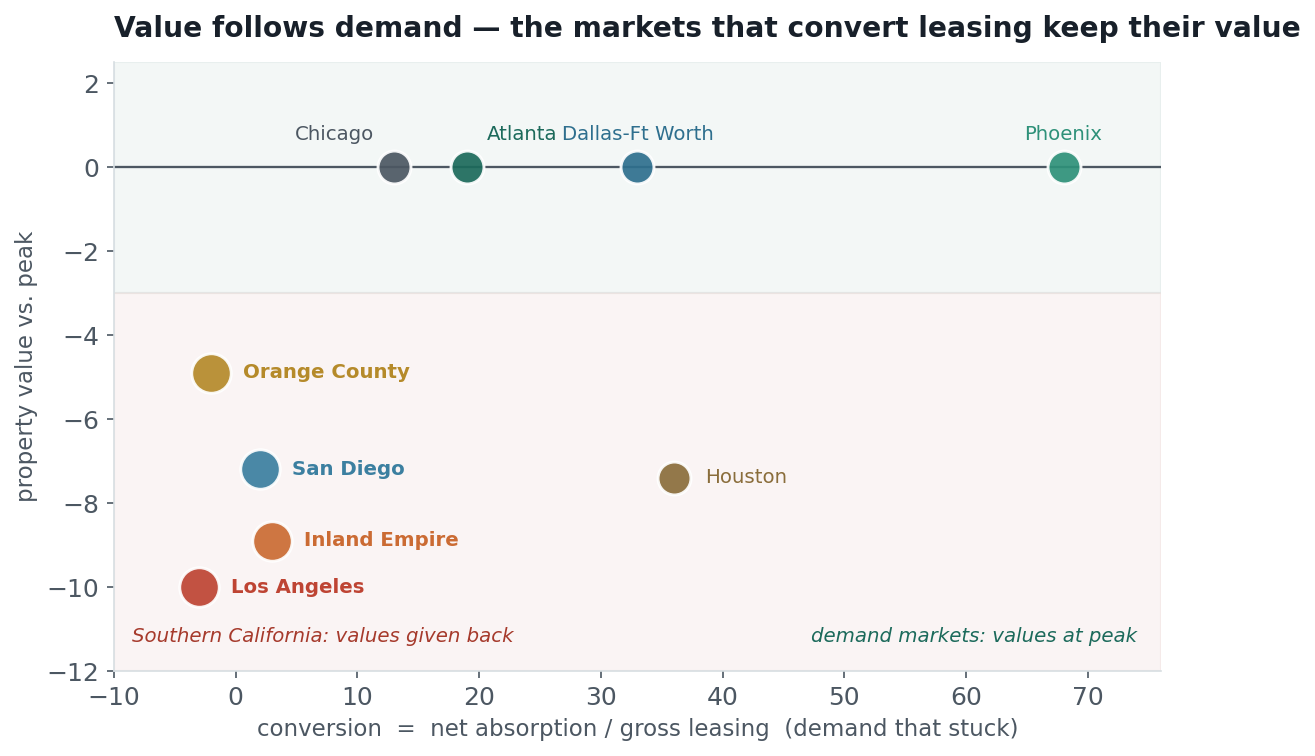
Off their 2022 highs, Los Angeles is down 10%, the Inland Empire 9%, San Diego 7%, Orange County 5%. What makes it unusual is the cause: it isn't the cap rate. Yields barely moved, LA's went from 5.1% to 5.3%, and in the Inland Empire the cap rate actually fell. When yields hold and value drops anyway, the loss is coming from income, not pricing. Buyers didn't demand a bigger return. The buildings simply earn less than they did at the peak. This is the rent correction, translated into what a building trades for.
For owners, one line of reassurance: this is a step back from the peak, not a round trip. Price per foot is still up 50% to 80% since 2019 across Southern California, the Inland Empire leading at +81%. Land and replacement cost are holding the floor. What came out is the 2021 to 2022 froth, not the decade of gains.
From the desk
That is the read we bring to every assignment: a national lens on where demand is actually going, the local dealmaking to act on it at every size, and the discipline to tell a busy market from a growing one. Not to mention our background and rolodex in supply chain and real estate development. If you own, occupy, or invest in industrial across the West, let's put these skills to work on your portfolio.
Senior Vice President and Principal
Smith Industrial Partners
Lee & Associates — Irvine
9838 Research Dr., Irvine, CA 92618
jbsmith@leeirvine.com
Sources
CoStar Market Analytics, 12 months ending Q2 2026, every U.S. industrial market above 200 million SF. Conversion = 12-month net absorption ÷ 12-month gross leasing. REIT figures: Prologis and Rexford Q2 2026 reports.