Industrial Insights Newsletter
Industrial Insights — Western Footprint Q3 2026
Vacancy is up. Leverage depends on the address and the size (as it always does).
Across the West, more industrial space is available, but the negotiating window is not opening evenly. Tenants below 50,000 SF still face limited choices in many infill locations. Requirements between 100,000 and 500,000 SF generally have more room to negotiate, particularly in the Inland Empire, Phoenix and Las Vegas.
The sales market is moving on a different clock. Capital has returned to several markets before leasing fundamentals have fully recovered. A 40,000-SF requirement in Santa Ana and a 300,000-SF requirement in Phoenix are very different negotiations, even when the regional headlines sound similar.
Download the complete 17-page Western Footprint report (PDF, 132 KB) for the full leasing, capital markets and representative-deal analysis.
Orange County
Large blocks are negotiable. Smaller infill space is still tight.
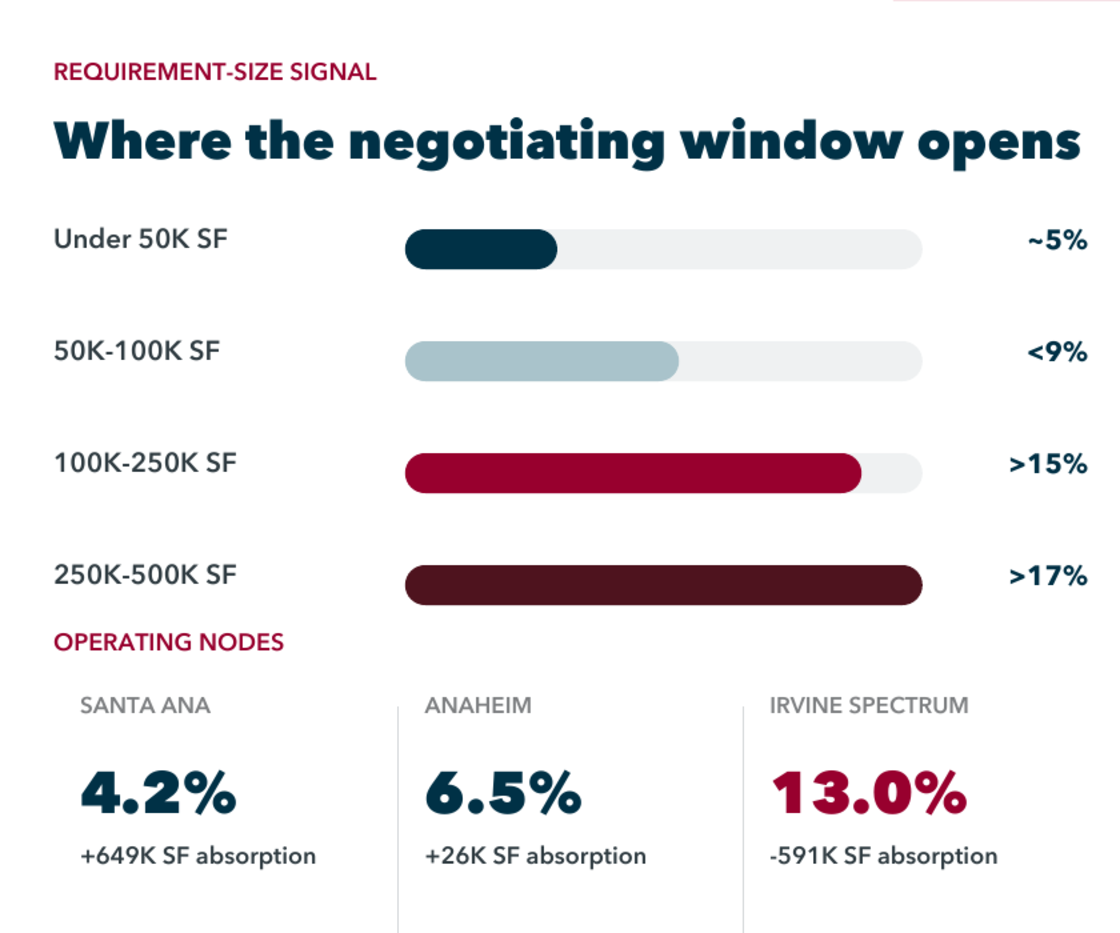
Leasing. Orange County vacancy is 6.4% versus a 4.5% historical average, but the headline hides the size split. Availability is near 5% below 50,000 SF, above 15% from 100,000 to 250,000 SF, and above 17% from 250,000 to 500,000 SF. Smaller requirements should start early; larger users should push harder on economics and flexibility.
Capital markets. $2.6 billion traded over the past year, although one portfolio transaction lifted the total. Owner-user demand and functional buildings below 100,000 SF remain the more durable ownership story.
Los Angeles
Leasing is active. Rents are still resetting.
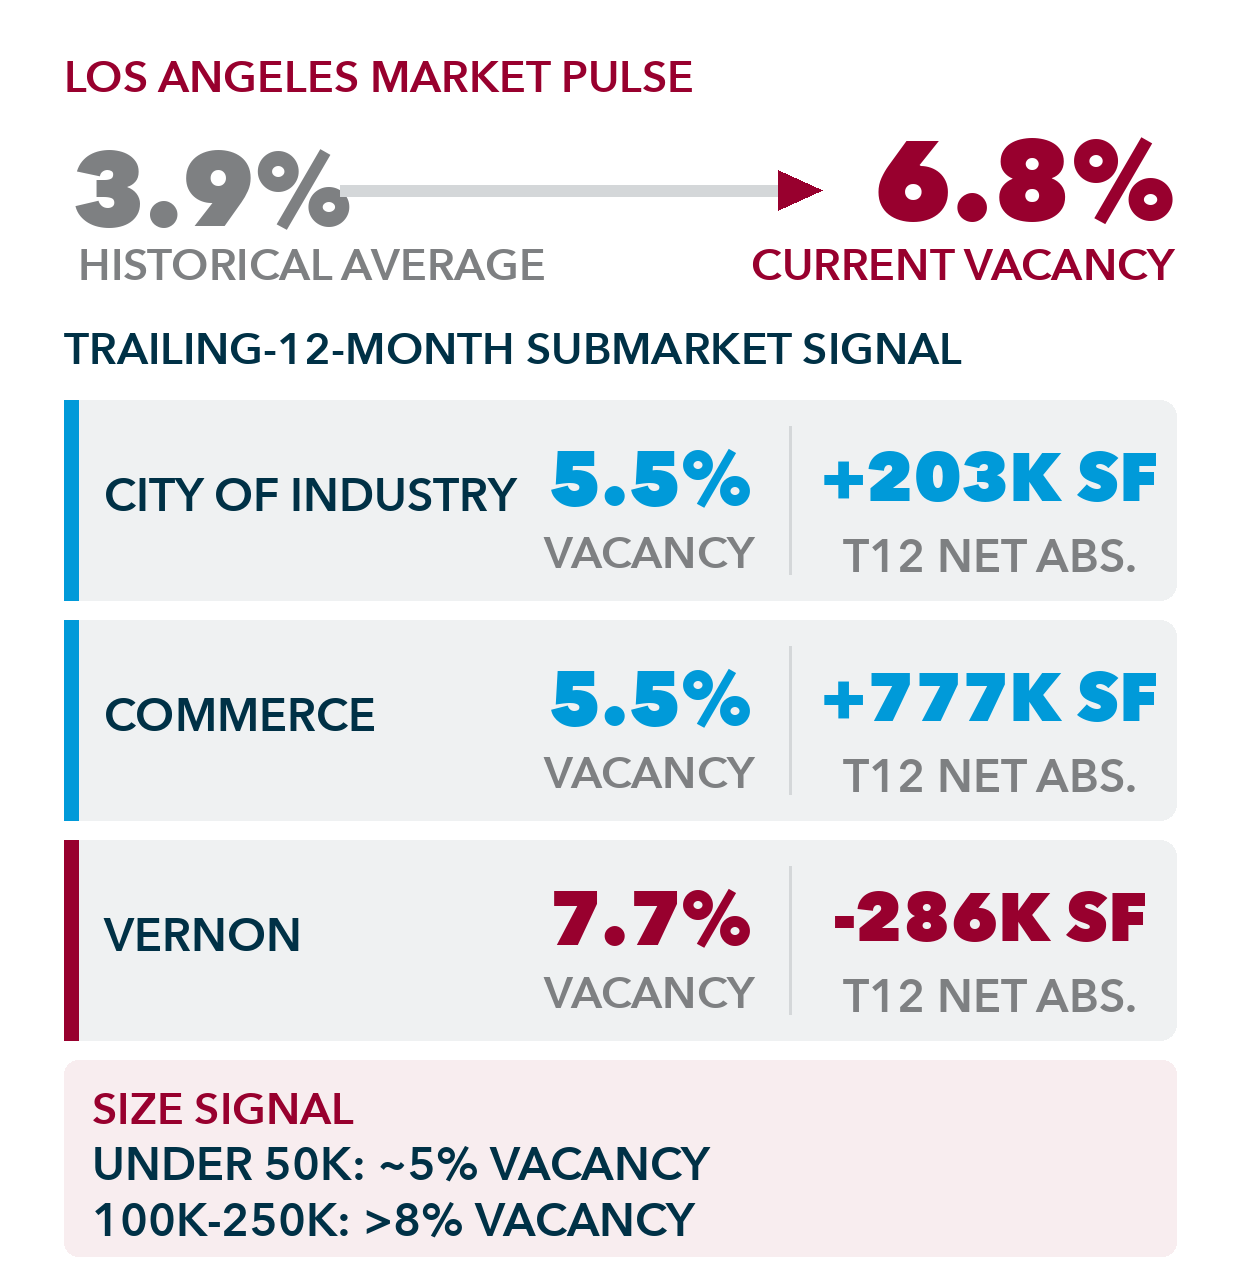
Leasing. More than 12 million SF was signed in Q2, but most of that activity represents turnover rather than expansion. Vacancy is 6.8% versus 3.9% historically, trailing absorption is negative 3.1 million SF, and rents are down 4.2%. City of Industry and Commerce are producing better operating signals than Vernon.
Capital markets. Sales reached $5.3 billion, but completed transactions averaged $288/SF versus a $314/SF modeled benchmark. Capital is moving before the leasing market has fully recovered, which makes current rent support more important than the headline sales total.
Inland Empire
Large-box absorption shifted east, but fundamentals remain mixed.
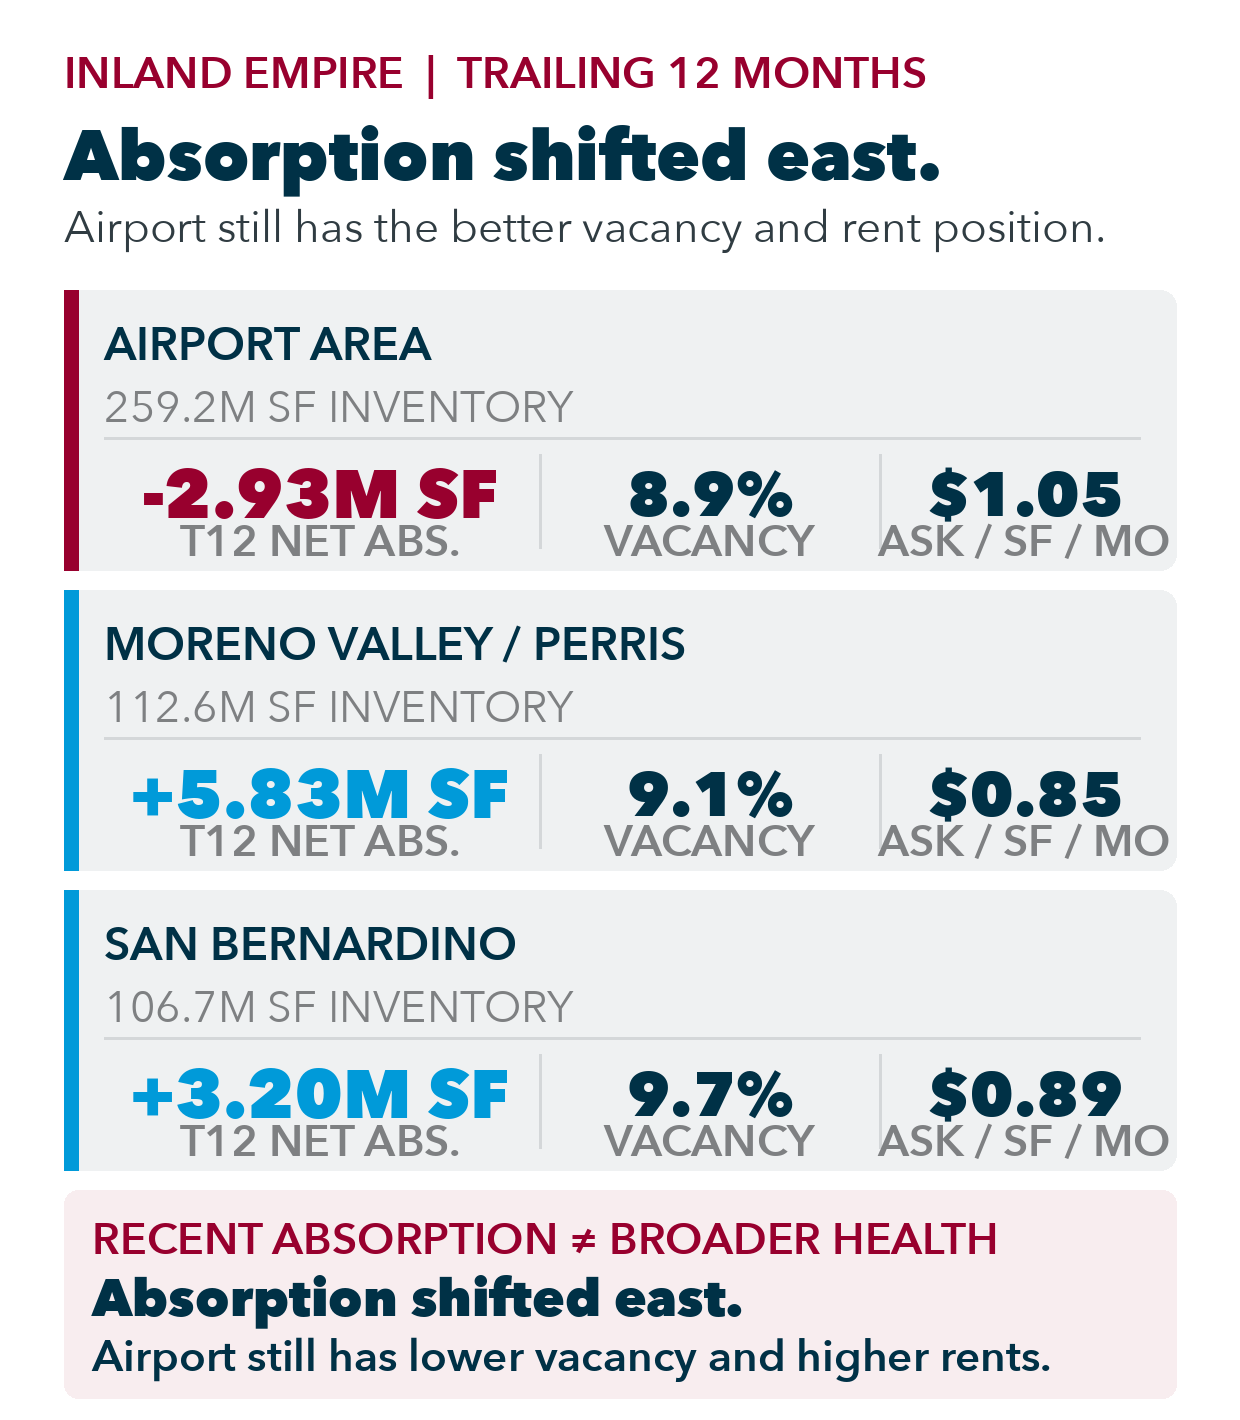
Leasing. Moreno Valley/Perris absorbed 5.83 million SF and San Bernardino 3.20 million SF over the trailing 12 months, while the Airport Area gave back 2.93 million SF. That does not make the east healthier across the board: Airport still has lower vacancy and higher asking rents, and several large move-ins drove the eastern gains.
Capital markets. $4.3 billion traded, but completed sales averaged $206/SF at a 5.8% cap rate versus a $258/SF and 4.9% modeled market benchmark. Underwrite rent and vacancy by submarket rather than applying one large-box valuation across the region.
San Diego
Otay Mesa has capacity. Kearny Mesa remains tight.
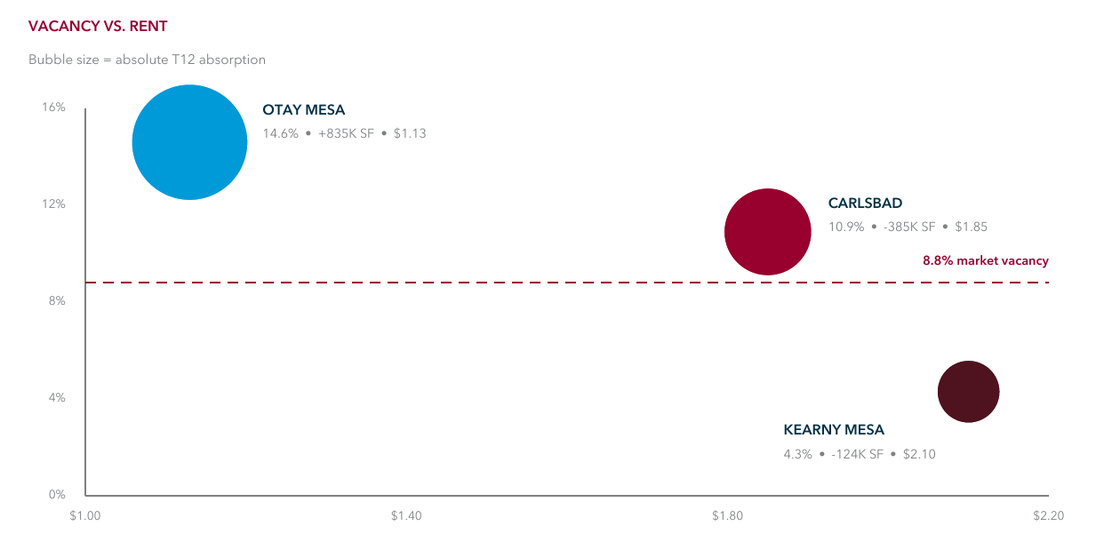
Leasing. Countywide vacancy is 8.8% versus 6.8% historically, but the operating nodes tell the useful story. Otay Mesa has 14.6% vacancy and positive absorption at a lower rent. Kearny Mesa remains much tighter and more expensive. Carlsbad and several North County nodes require more caution.
Capital markets. Sales volume is above normal, but liquidity is concentrated in larger and specialized transactions. Carlsbad, Kearny Mesa and Torrey Pines have very different product mixes, so price per square foot alone is a weak comparison.
Phoenix
Demand is strong, but the middle of the market favors tenants.
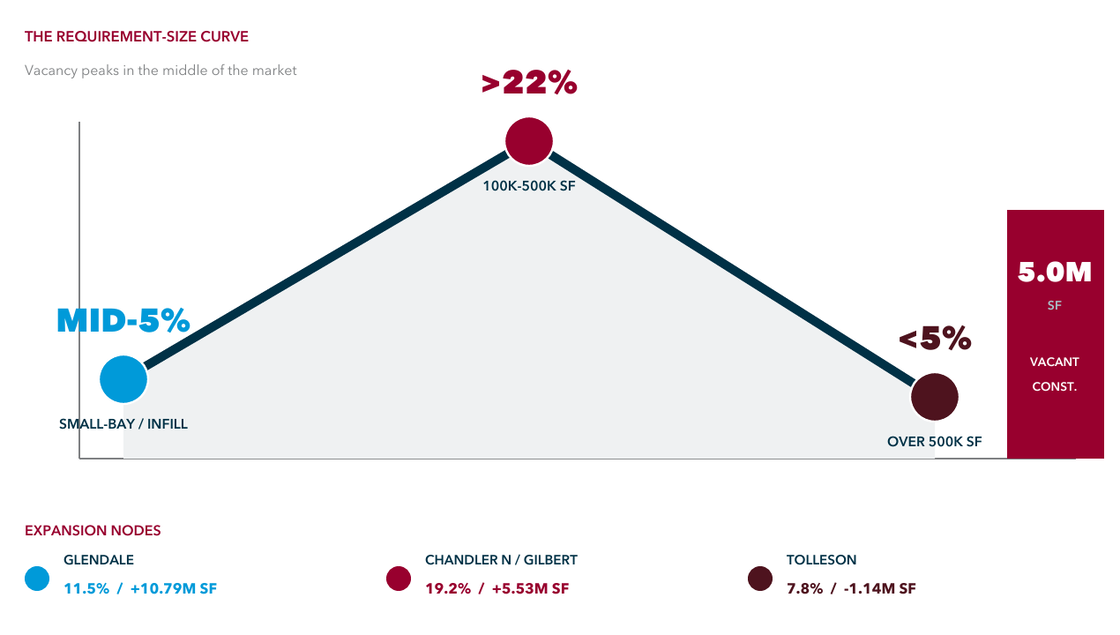
Leasing. Phoenix absorbed 23.2 million SF, more than two and a half times its historical average. The opportunity is concentrated in 100,000-to-500,000-SF logistics buildings, where vacancy exceeds 22%. Smaller infill buildings and facilities above 500,000 SF are comparatively tight.
Capital markets. $5.6 billion traded over the past year, led by Glendale, Chandler North/Gilbert and Tolleson. For Southern California users considering expansion, Phoenix offers real capacity—but the correct building-size band matters more than the metro average.
Las Vegas
Useful overflow capacity when the operating case works.
Leasing. Vacancy is 11.1%, well above the 7.6% historical average. Las Vegas can solve an I-15, Nevada-service, labor or tax objective, but it is not automatically a lower-cost substitute for Southern California. Transportation, customer service and facility fit have to support the move.
Capital markets. Trailing sales volume is slightly below normal, with North Las Vegas providing the deepest pool of ownership activity. Smaller submarkets require more careful comparable-sale work.
United States Data Centers
Power is becoming an industrial location variable.
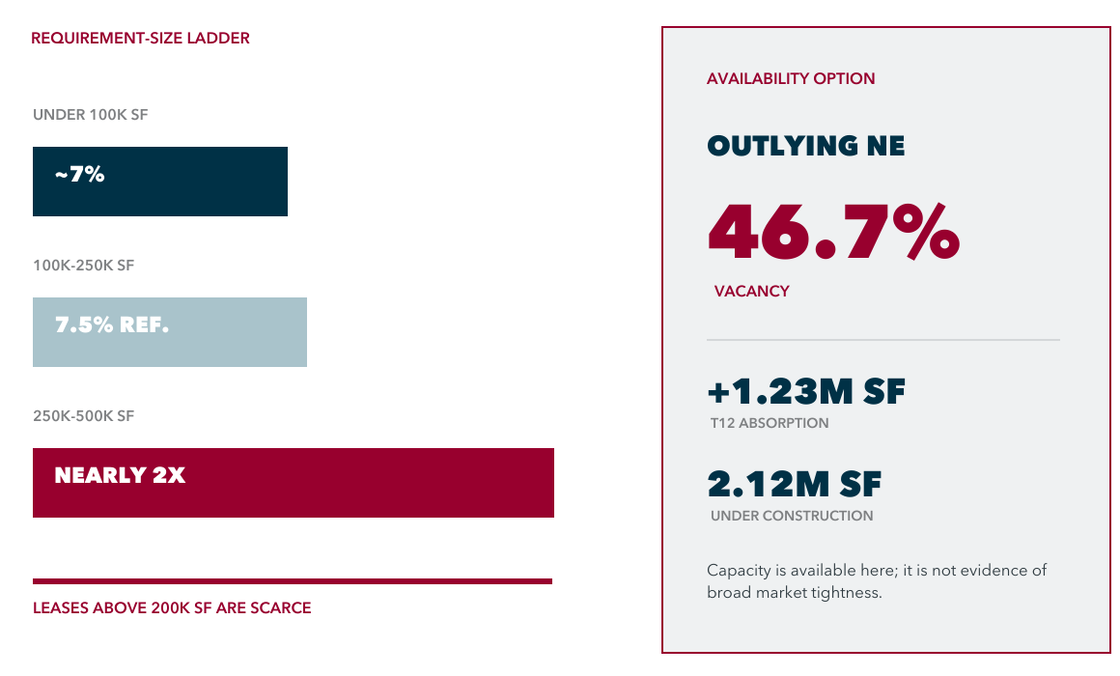
Development. The United States has approximately 69 GW of operating capacity and another 43 GW under construction—about 62% of the operating base. Much of that pipeline is already preleased or purpose-built, so construction does not translate directly into available capacity. For site selection, the practical filter is power, land, fiber and speed to energization.
Capital markets. Seventy-seven properties generated roughly $7.5 billion in trailing sales. The three-year average was $6.3 million per MW, while the top 20% reached $19.6 million per MW. Hines' $63.1 million acquisition of the 162,803-SF Lightedge facility in Kearny Mesa is a useful local example. Price per square foot is context; usable power is the underwriting variable.
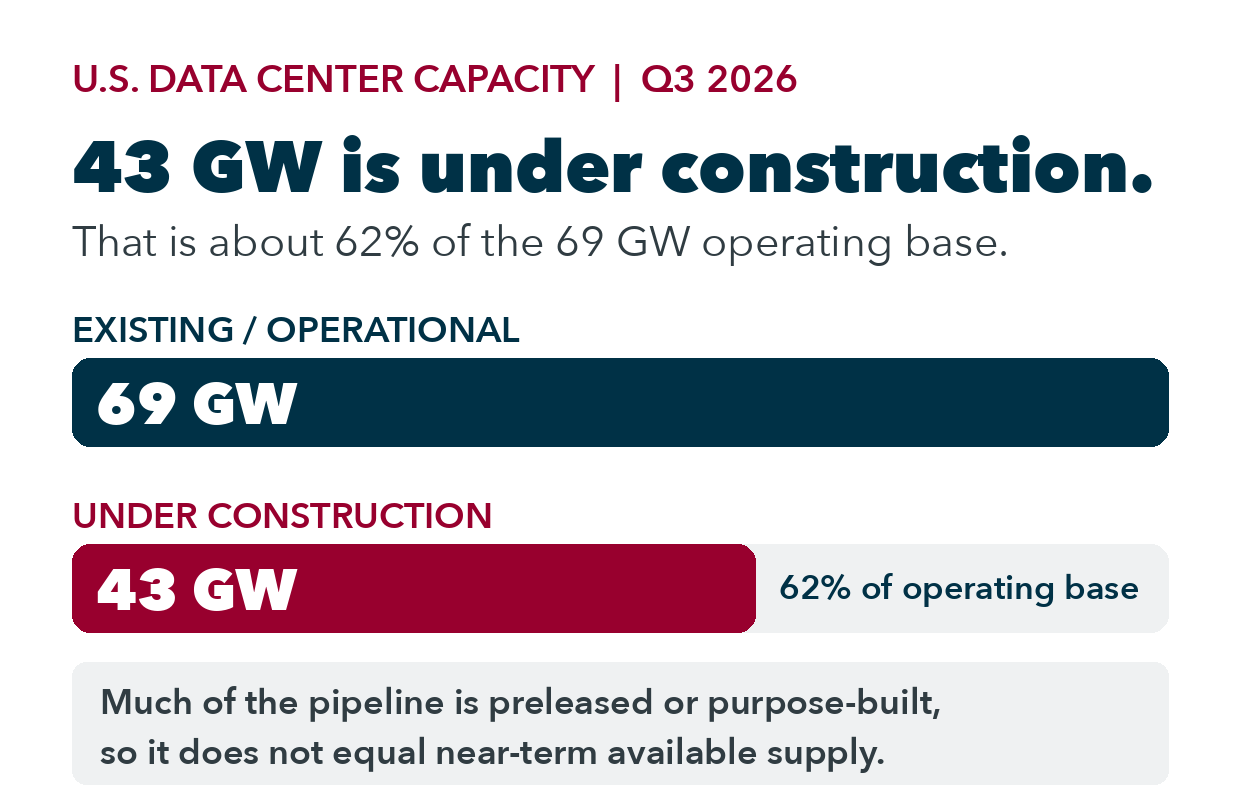
Data-center source note: CoStar U.S. Data Center Report, Q3 2026, p. 3. The 62% comparison is calculated as 43 GW divided by 69 GW.
From the desk
Before comparing markets, define the problem the next facility has to solve: cost, labor, capacity, service, power or a lease event. Orange County and Los Angeles still reward an early start for smaller infill requirements. The Inland Empire and Phoenix offer more leverage in selected size ranges. Las Vegas can be compelling when the operating case is real. The building and submarket should follow that decision—not the other way around.
Tell me the market and size. I will show you the options. Send the market, approximate square footage and lease-expiration year. I will share the five most relevant availabilities, recent lease and sale comps, and a practical stay-versus-expand comparison. You can also download the complete report.
Senior Vice President and Principal
Smith Industrial Partners
Lee & Associates — Irvine
9838 Research Dr., Irvine, CA 92618
jbsmith@lee-associates.com
Sources
CoStar industrial market and industrial capital markets reports for Orange County, Los Angeles, Inland Empire, San Diego, Phoenix and Las Vegas, dated August 27, 2026; CoStar U.S. Data Center Report, Q3 2026. Current or trailing-12-month data unless noted. Modeled market estimates and observed transactions are identified separately.